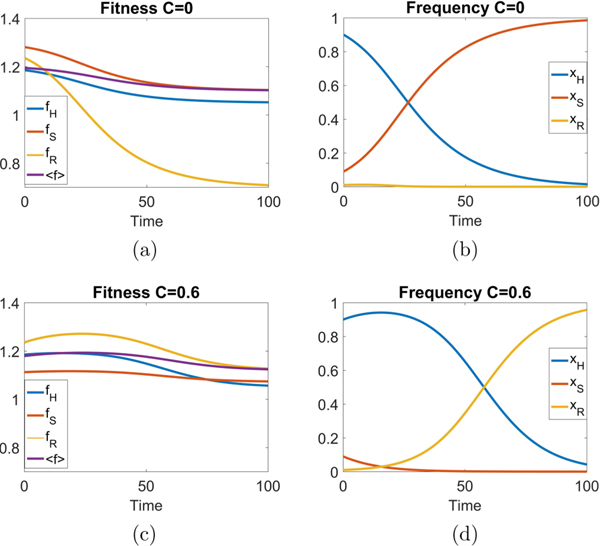
FIG. 6.
Fitness landscapes as a function of time. With no therapy (C = 0), the fitness curves are continuously decreasing functions as the tumor saturates with the sensitive cell population in a sigmoidal shaped growth curve. With continuous therapy (C = 0.6), the fitnesses initially increase indicating tumor regression, but eventually decrease. The healthy subpopulation initially increases before the resistant population eventually saturates the tumor. Initial condition (0.9,0.09,0.01) with w0 = 0.1

