. 2020 Sep 11;9:e57212. doi: 10.7554/eLife.57212

Figure 1. S. pombe DNA inserted into a mouse chromosome adopts a distinct structure on mitotic chromosomes.

(A) Metaphase spreads of mouse F1.1 chromosomes showing the distinct structure of the S. pombe DNA insert. Propidium iodide stained DNA (PI, red), S. pombe DNA FISH using probes from total S. pombe DNA (green – yellow arrows), centromeres (regions of brighter DNA staining - blue arrows). Scale bars: 1 μm. (B) Schematic representation and average chromosome profile of the F1.1 insert-bearing chromosome across several images (n = 16, Figure 1—source data 1). Signal intensities of PI DNA stain (red) and FISH signal (green) were measured along the length of the chromosomes and binned according to their position, from the centromere (0–5%) to the telomere (95–100%). Error bars represent ± standard error from the mean (SEM). Average DNA stain intensity was compared between the regions of 25–40% (endogenous mouse DNA) and 65–80% (S. pombe DNA corresponding to the highest FISH signal) by the KS test (**p<0.001). (C and D) Metaphase spreads of F1.1 cells either stained by immunofluorescence for histone H4 (C) or expressing tagged histone H2B-GFP (D) (red), with S. pombe DNA FISH (green) and DAPI-stained DNA (blue). S. pombe DNA (yellow arrows) and centromere (blue arrows) locations are indicated. Scale bars: 1 μm. (E and F) Average signal intensity profile of the F1.1 insert-bearing chromosome showing FISH and either anti-H4 (E, Figure 1—source data 2) or H2B-GFP (F, Figure 1—source data 3) across several images (n = 28, 27). Error bars represent ± SEM. Average histone levels were compared between the regions of endogenous mouse DNA and S. pombe DNA highlighted by FISH by the KS test (**p<0.001).

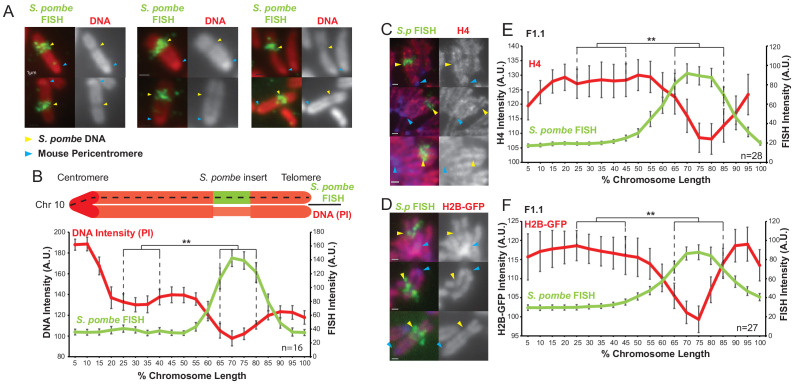
Figure 1—source data 1. FISH and PI intensity measurements for Figure 1B.
Figure 1—source data 2. FISH and anti-H4 intensity measurements for Figure 1E.
elife-57212-fig1-data2.xlsx (198.6KB, xlsx)
Figure 1—source data 3. FISH and H2B-GFP intensity measurements for Figure 1F.
elife-57212-fig1-data3.xlsx (109.4KB, xlsx)

Figure 1.

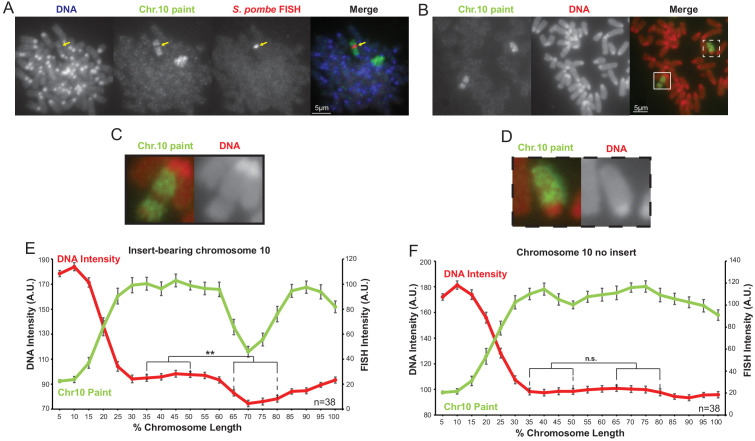
Figure 1—figure supplement 1. The distinct chromatin structure of the S. pombe DNA insert on chromosome 10 is not an artefact of the FISH procedure.

Figure 1—figure supplement 1.

(A) Two-colour FISH of F1.1 metaphase spreads for S. pombe DNA (red, middle-right, yellow arrows), and mouse chromosome 10 (green, middle-left) with DAPI-stained DNA (blue, far left). (B) Metaphase spread of F1.1 probed with a mouse chromosome 10 paint only (green) with PI-stained DNA (red). The insert-bearing chromosome 10 is recognisable by a distinct region not highlighted by FISH, corresponding to the S. pombe DNA. Scale bars: 5 μm. (C,D) Enlarged images of the regions highlighted in B showing an S. pombe DNA insert-bearing (C) and non-insert bearing (D) copy of chromosome 10. (E,F) Average chromosome profile of the insert-bearing (E, Figure 1—figure supplement 1—source data 1) and homologous non-insert-bearing (F, Figure 1—figure supplement 1—source data 2) copies of chromosome 10 in F1.1 metaphase spreads across several images (n = 38). Error bars represent ± SEM. Average DNA stain intensity was compared between the regions of DNA at 35–50% and 65–80% (where the S. pombe DNA was detected on the insert-bearing chromosome) by the KS test (**p<0.001, n.s. = not significant).
Figure 1—figure supplement 1—source data 1. FISH and PI intensity measurements for Figure 1—figure supplement 1E.
Figure 1—figure supplement 1—source data 2. FISH and PI intensity measurements for Figure 1—figure supplement 1F.