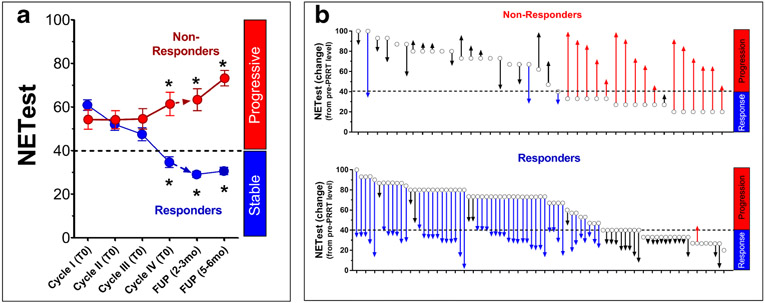
Fig. 2: NETest levels following PRRT administration (n=122).
2A. Dynamics of the biomarker and treatment. RECIST-responders (blue) were associated with a significant decrease (*p<0.05) in the NETest following therapy. Levels were lowest at follow-up falling into the “stable” NETest score category (SD ≤40), consistent with a treatment response (“Responders”). In non-responders (red), the mean NETest was initially unchanged but thereafter significantly increased (*p<0.05) in those who progressed (“Non-Responders”). NETest levels fell into the “progressive” NETest score category (PD >40).
2B. Modified waterfall Plot Analysis. Responders (n=83) are designated blue and non-responders (n=39) red. Open circles represent pre-PRRT NETest absolute levels. Changes in NETest levels are indicated by arrows (pre-treatment to biomarker level at follow-up). Red arrows identify a NETest increase and a category change to progressive (non-responsive). Blue arrows identify a NETest decrease in and a category change to responsive. In the responder group, 98% exhibited a decrease while in the non-responder group, 75% displayed a biomarker level increase (Fisher’s p<0.0001).

