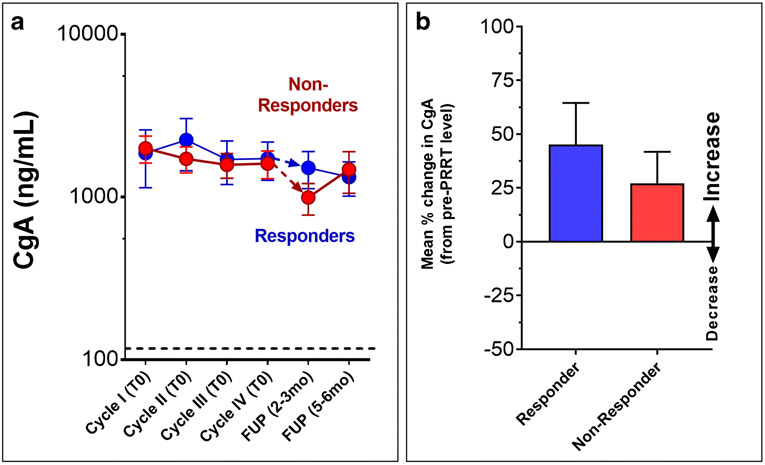
Fig. 6: Changes in CgA with PRRT (n=112).
6A. Dynamics of the biomarker and treatment. Responders were not associated with a significant decrease in CgA levels following therapy. Similarly, no significant differences were identified in CgA levels in non-responders.
6B. Mean changes in CgA levels (between follow-up and baseline) in responders (n=76) compared to non-responders (n=36). CgA levels were increased and mean levels were not significantly different between responders and non-responders.

