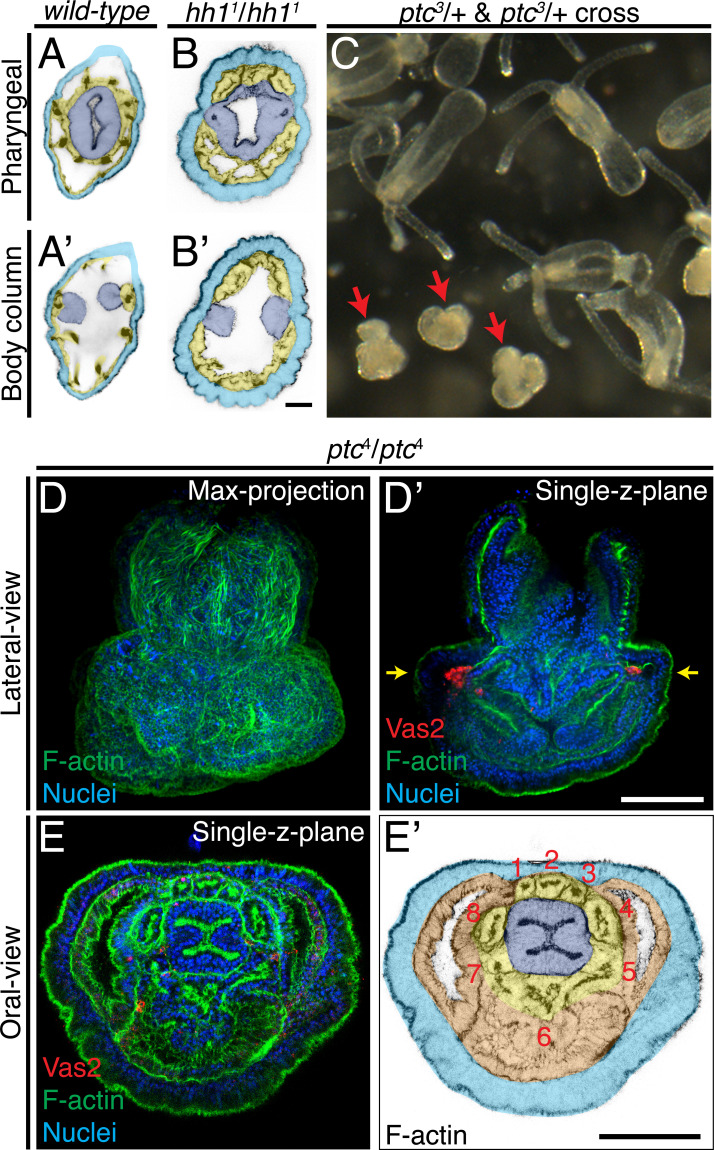
Figure 10. Patterning defects in hh1 and ptc mutants.
(A–B’) In addition to loss of putative PGCs, hh1 mutant polyps show endomesodermal patterning defects. Parts of the pharyngeal ectoderm and septal filaments (navy blue) abnormally contact the outer epidermis (azure blue), without endomesoderm tissue in between (yellow). These contacts segregated the normally contiguous eight endomesodermal segments into blocks of three and five segments along the directive axis. (C) Eighteen dpf F2 progeny from a cross between ptc3/+ heterozygous siblings. The abnormal mushroom-shaped polyps are indicated by red arrows. (D–D’) At the primary polyp stage (12 dpf), homozygous ptc mutants lack the four primary tentacles and do not develop the normal polyp body plan. (E–E’) A single focal plane taken at the level indicated by yellow arrows in D’. Depite significant morphological defects, ptc mutant animals develop a pharynx (navy blue), eight endomesodermal segments (yellow), body wall endomesoderm (orange) and putative PGC clusters (labeled by Vas2 immunofluorescence in red in D’). Scale bar = 20 µm in B’; 50 µm in D’ and E’. A-B’ are at the same scale; D–D’ are at the same scale; E–E’ are at the same scale.


