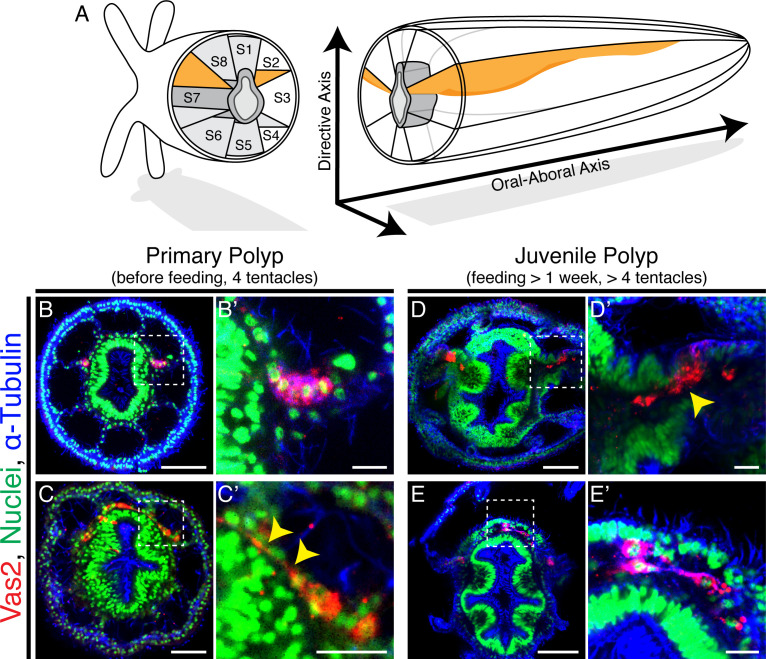
Figure 2. Putative Nematostella PGCs delaminate through epithelial-mesenchymal transition (EMT) and appear to migrate to non-primary mesenteries.
(A) Schematic diagram of Nematostella polyp anatomy depicts the pharynx and mesentery arrangements at the pharyngeal level. The eight mesenteries (two primary mesenteries in orange and six non-primary mesenteries in light gray) harbor gonad epithelium, muscle and digestive tissue. The internal structures of Nematostella are arrayed around the pharynx (dark gray). The Directive and Oral-Aboral axes are indicated. Segment nomenclatures follow He et al., 2018. (B–B’) Paired clusters of putative PGCs labeled by Vas2 immunofluorescence (red) initially exhibit epithelial charateristics. (C–C’) Putative PGCs from >10 dpf primary polyps appear to stretch their cell bodies basally (yellow arrowheads). (D–D’) Following nutrient intake, putative PGCs delaminate into the mesoglea through an apparent EMT (yellow arrowhead). (E–E’) In the mesoglea, these Vas2+ cells exhibit fibroblast-like morphology and are detected between mesenteries at the level of the aboral pharynx. Scale bar = 50 µm in B, D, and E; 20 µm in C; 10 µm in B’, C’, D’, and E’.


