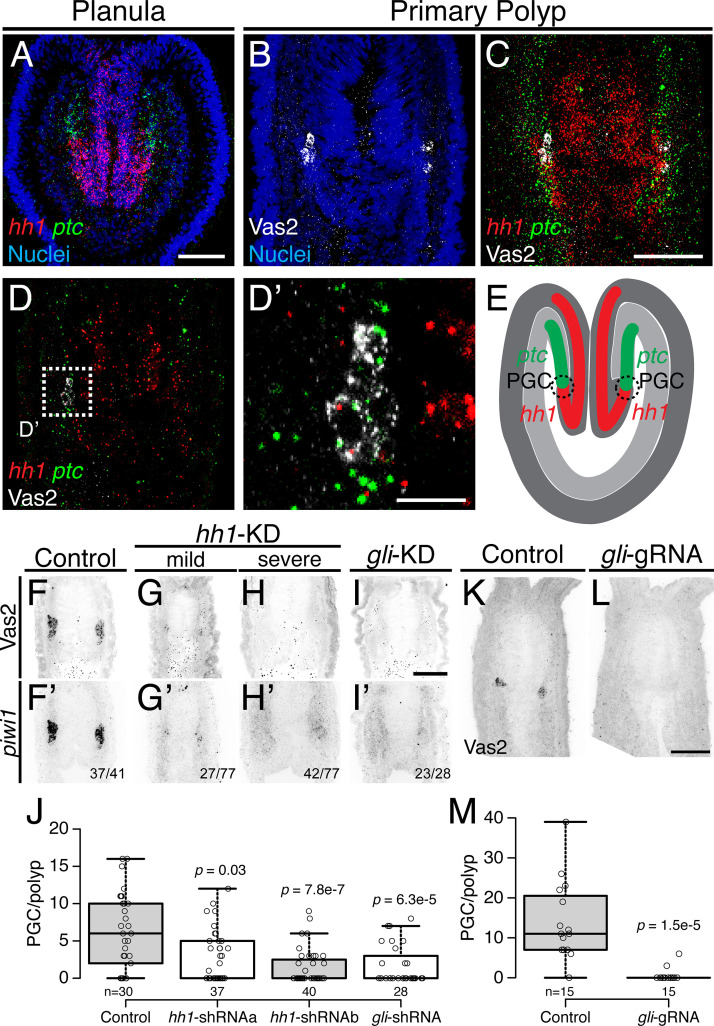
Figure 7. Hh signaling is required for Nematostella PGC formation.
(A) Prior to PGC specification in planula larvae, hh1 (red) and ptc (green) are expressed in pharyngeal ectoderm and endomesoderm, respectively. (B–D’) In primary polyps, PGC clusters (white) are specified within the ptc expression domain, neighboring the hh1 domain. (D) Selected single focal plane of C. (D’) Enlarged view of boxed area in D, showing PGCs expressing ptc (green) and low hh1 signal (red). (E) Diagram depicting the relative expression domains of hh1 and ptc and PGC specification during metamorphosis. (F–I’) PGC formation on 8 dpf—indicated by Vas2 immunostaining and piwi1 fluorescent in situ hybridization—is impaired by hh1 or gli shRNA knockdown. (J) PGC numbers were significantly reduced following hh1 or gli knockdown. p values of ANOVA tests were compared with control GFP-shRNA injection. (K–M) gli gRNAa, gRNAb and Cas9 protein injected embryos showed reduced PGC numbers in six dpf primary polyps. p value of ANOVA test was compared with control GFP-gRNA injection. Scale bar = 50 µm in A, C, I and L; 10 µm in D’. B-D’ are at the same scale; F–I’ are at the same scale; K and L are at the same scale.


