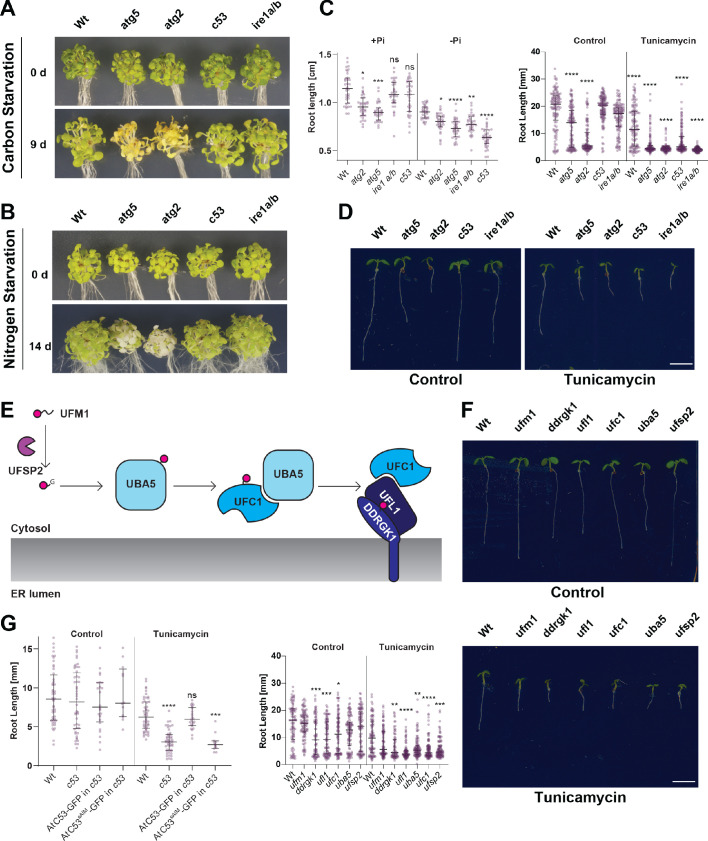
Figure 10. C53 is crucial for ER stress tolerance.
(A) Atc53 mutant is insensitive to carbon starvation. Phenotypes before (0 d) and after 9 days carbon starvation (9 d) of 7-day-old seedlings, n ≥ 20 seedlings per genotype. (B) Atc53 mutant is insensitive to nitrogen starvation. Phenotypes before (0 d) and after 14 days nitrogen starvation (14 d) of 7-day-old seedlings, n ≥ 20 seedlings per genotype. (C) Atc53 mutant is sensitive to phosphate starvation. Root-length quantification of seven-day-old seedlings which were transferred to media with or without Pi supplement (+Pi, -Pi), and imaged after 2 days. (D) Atc53 mutants are sensitive to ER stress induced by tunicamycin. Root-length quantification of 7-day-old seedlings grown on half strength MS media without sucrose treated with 100 ng/mL tunicamycin (Tm). Bottom Panel, Root-length quantification of 7-day-old seedlings. n≈125 seedlings per genotype and treatment. Left Panel, Example of 7-day-old seedlings grown in described conditions. Scale bars = 5 mm. Left, non-treated seedlings. Right, seedlings grown at 100 ng/mL Tm. Right Panel, Root length of each genotype was compared pairwise with the wild type (Col-0) for each specific treatment condition. (E) Main molecular players in the ufmylation pathway. UFSP2: UFM1-specific protease two that matures UFM1, exposing the terminal glycine residue. UBA5: the E1 activating enzyme, UFC1: E2 conjugating enzyme, UFL1: E3 ligase (F) Ufmylation pathway mutants are sensitive to ER stress triggered by tunicamycin. Root length quantification of 7-day-old seedlings grown on half strength MS media without sucrose treated with 100 ng/mL tunicamycin (Tm). Left panel, Root length quantification of 7-day-old seedlings. n≈100 seedlings per genotype and treatment. Right Panel, Representative images of 7-day-old seedlings grown in described conditions. Scale bars, 5 mm. To the left are non-treated seedlings, to the right are seedlings grown at 100 ng/mL Tm. (G) AtC53sAIM mutant does not complement tunicamycin sensitivity phenotype. Root length quantification of indicated 7-day-old seedlings grown on half strength MS media without sucrose in control conditions (Ctrl) or treated with 100 ng/mL tunicamycin (Tm). T1 transgenic lines were used. n = 12 seedlings per genotype and treatment. Data represent the median with its interquartile range. Root length of each genotype was compared pairwise with the wild type (Col-0) for each treatment condition. Significant differences compared to control treatment (Ctrl) are indicated with * when p value ≤ 0.05, ** when p value ≤ 0.01, and *** when p value ≤ 0.001.


