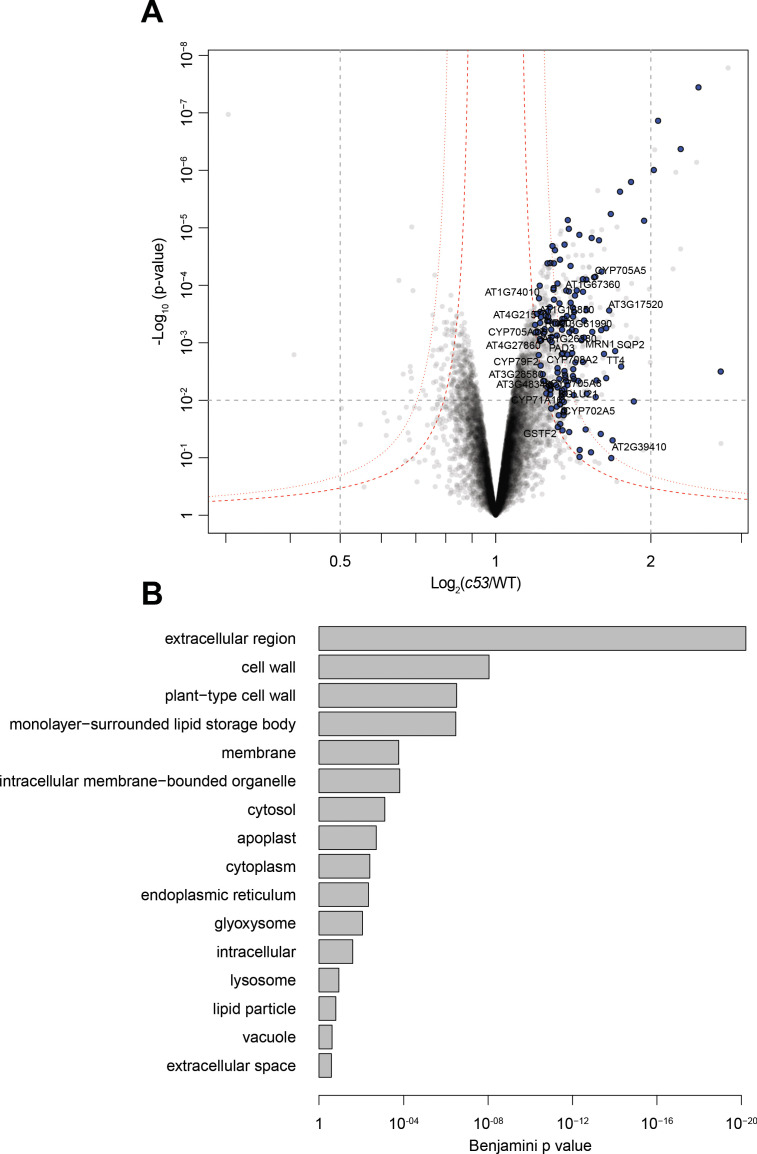
Figure 6. Quantitative proteomics analyses of AtC53 mediated degradation.
(A) Volcano plot showing proteins that are accumulating in Atc53 mutants Names of ER resident proteins are shown. Proteins that are labeled with blue either reside or mature at the ER. (B) GO analysis of proteins accumulating in Atc53. See Supplementary file 3 and 4 for details.

