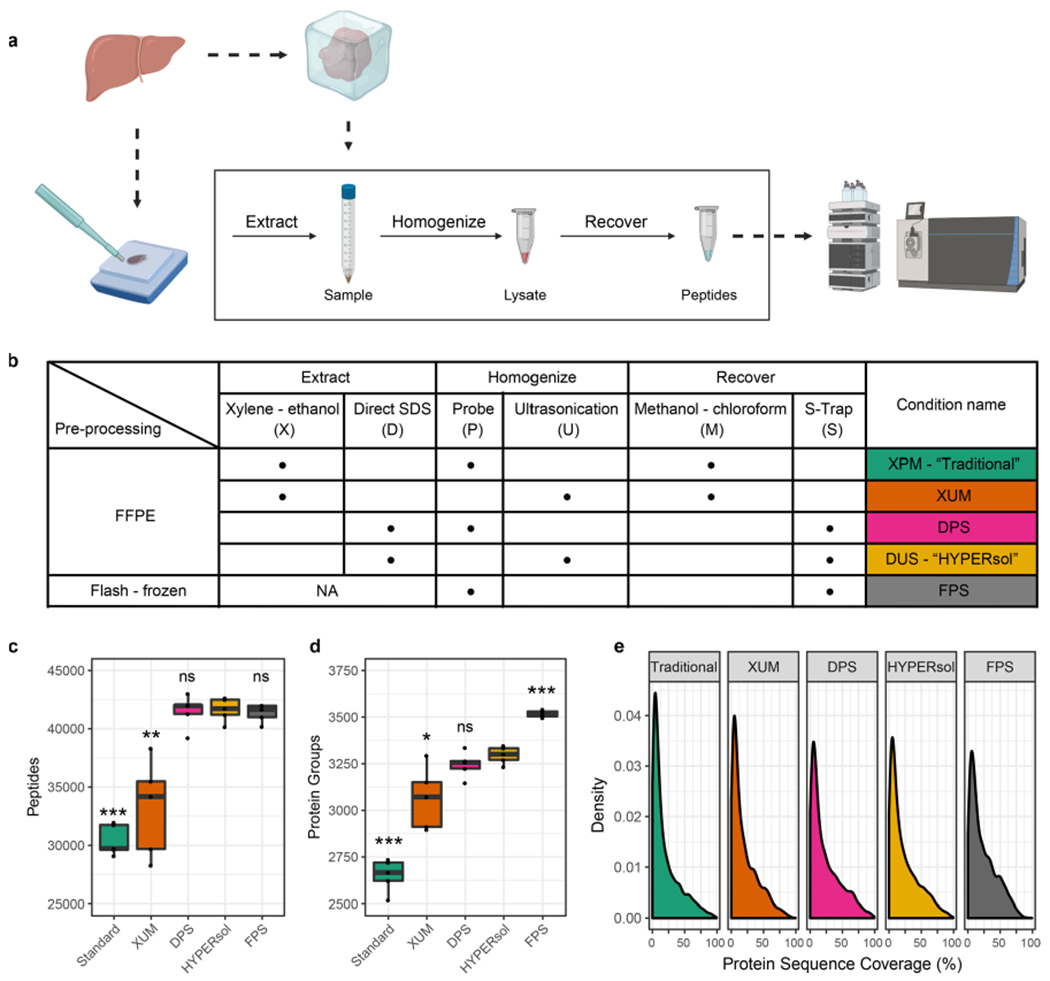
Figure 1.

HYPERsol improves the depth-of-coverage achievable from FFPE samples compared to the Traditional workflow. (a) Schematic illustrating study design. Freshly dissected liver samples were either flash-frozen or formalin-fixed and paraffin-embedded prior to proteomic analysis. (b) Table of experimental conditions. (c) Tukey boxplot displaying the number of peptide identifications across conditions. (d) Tukey boxplot displaying the number of protein group identifications across conditions. (e) Density plot illustrating protein sequence coverage across conditions. The conditions were as follows. Traditional: xylene–ethanol, probe, methanol–chloroform. XUM: xylene–ethanol, ultrasonication, methanol–chloroform. DPS: direct, probe, S-Trap. HYPERsol: direct, ultrasonication, S-Trap. FPS: flash-frozen, probe, S-Trap. For box plots, n = 5 and asterisks indicate statistical significance when compared to FPS with Welch’s two-tailed t test and p < 0.05 = *, p < 0.01 = **, and p < 0.001 = ***.
