Figure 2.

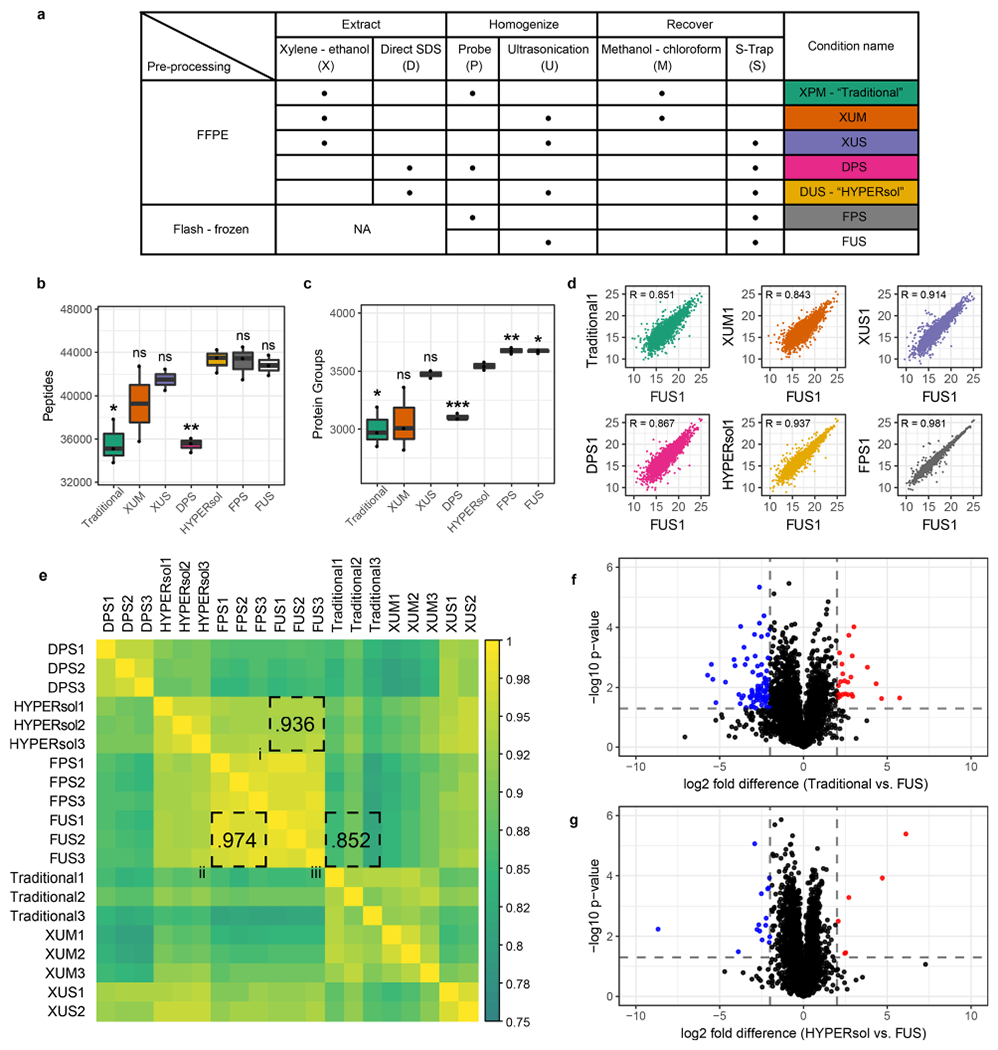
HYPERsol yields proteomic data that closely resemble matched flash-frozen tissue. (a) Table of experimental conditions. The conditions were as follows. Traditional: xylene–ethanol, probe, methanol–chloroform. XUM: xylene–ethanol, ultrasonication, methanol–chloroform. XUS: xylene–ethanol, ultrasonication, S-Trap. DPS: direct, probe, S-Trap. HYPERsol: direct, ultrasonication, S-Trap. FPS: flash-frozen, probe, S-Trap. FUS: flash-frozen, ultrasonication, S-Trap. (b) Tukey boxplot displaying the number of peptide identifications across conditions. (c) Tukey boxplot displaying the number of protein group identifications across conditions. For both (b) and (c), n = 3 for all conditions except XUS, for which n = 2, and asterisks indicate statistical significance when compared to HYPERsol with Studenťs two-tailed t test and p < 0.05 = *, p < 0.01 = **, and p < 0.001 = ***. (d) Representative scatter plots depicting the correlation between proteomic data from each experimental condition against data from FUS. R values are Pearson correlation coefficients. (e) Correlation matrix depicting the Pearson correlation coefficients across all pairwise run comparisons. In this panel, shorthand is used for both Traditional (XPM) and HYPERsol (DUS) for the sake of space. (f) Volcano plot comparing the relative abundance of proteins detected in both the Traditional and FUS conditions. (g) Volcano plot comparing the relative abundance of proteins detected in both the HYPERsol and FUS conditions. Dotted lines indicate absolute log2 fold-difference = 2 and p-value = 0.05.
