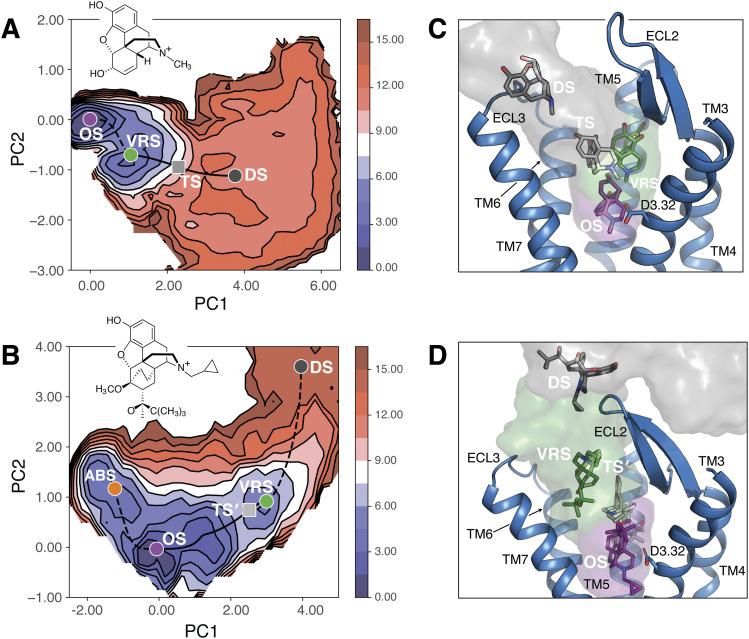
FIG. 4.
Energetic and structural descriptions of the morphine-MOPr and buprenorphine-MOPr dissociation processes. FES of (a) morphine and (b) buprenorphine projected onto the first two principal components from PCA of the combined AMINO-based molecular features, the reaction coordinate describing the drug’s hydration state, and the distance from D1473.32 used to define an unbinding event. The MEPs predicted by the NEB method are plotted onto these FES as black dashed lines connecting cluster centers/minima (colored dots), unless they refer to the rate-limiting steps in which case they are shown as solid black lines. The transition states along these paths (TS and TS′ for morphine-MOPr and buprenorphine-MOPr, respectively) are shown as gray squares. [(c) and (d)] Representative conformations for each minimum, including the orthosteric ground state (OS; purple), the vestibule region state (VRS; green), and the solvent-exposed/dissociated states (DS; dark gray) as well as for the rate-limiting transition states (TS and TS′ ; light gray). MOPr TM helices are shown in cartoon representations with TM1 and TM2 helices not displayed for clarity.

