Figure 4.
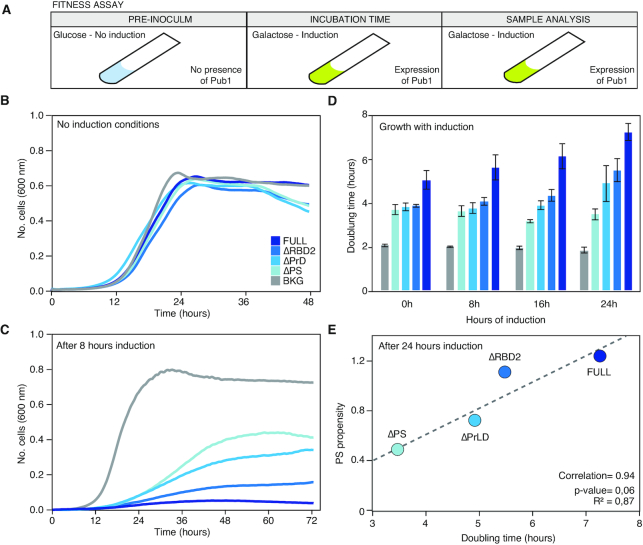
Changes in the growth curve after the expression of the different Pub1 variants. (A) Scheme of the different steps followed to prepare the cell samples before the growth curve analysis. The pre-inoculum was in glucose media, then the cells were incubated in inducing conditions during different times (0, 8, 16 and 24 h; Supplementary Tables S1 and 2) before growth characterization in presence of galactose (the inducer). (B) Growth curves in no-inducing conditions (glucose) to control background fitness between strains. (C) Growth curves where monitored for 3 days in inducing conditions (see Supplementary Table S1). The graph exhibits growth curves upon induction and after 8 h of induction. (D) Bar plots indicating the doubling time of different variants measured after induction times. For lag time and saturation limit see Supplementary Table S1. (E) Linear correlation between the propensity to PS calculated with catGRANULE and the doubling time measured after 24 h of induction.

