Figure 1.
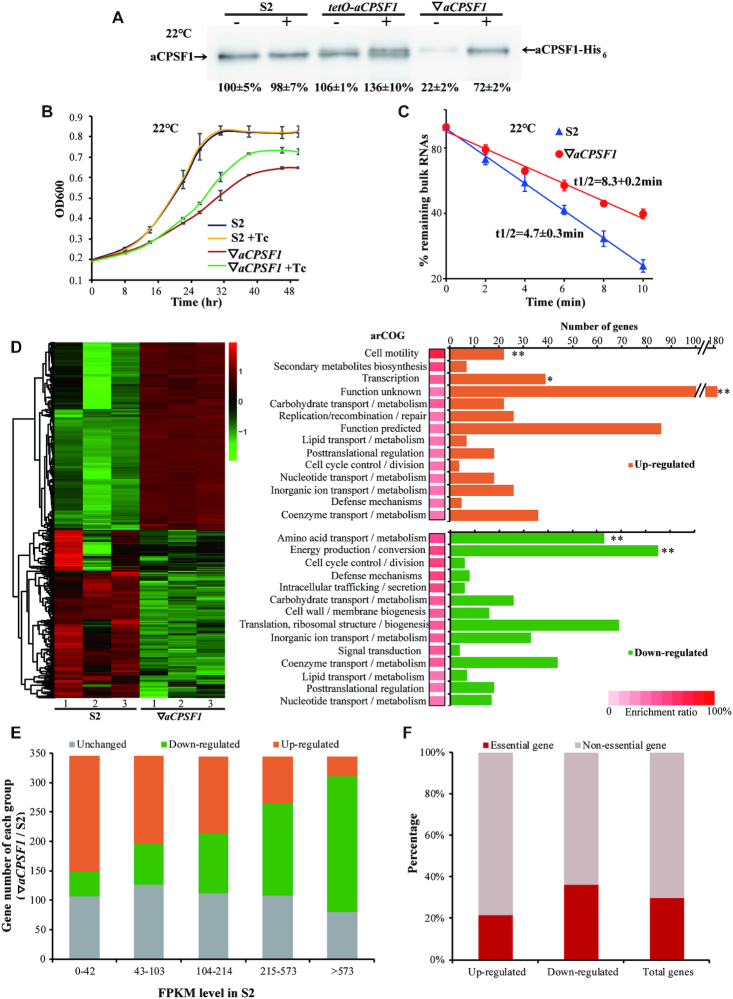
Depleted expression of Mmp-aCPSF1 results in reduced growth, prolonged RNA lifespan, and a disordered transcriptome of 22°C-cultured M. maripaludis. (A) Western blot assayed Mmp-aCPSF1 protein abundance (percentages referenced to lane 1) with (+) or without (–) 100 μg/ml of tetracycline in 22°C-grown S2 (wild-type), tetO-aCPSF1, and ▽aCPSF1. Averages and standard deviations of three replicates are shown. aCPSF1 and aCPSF1-His6 flanking the gel point the indigenous- and hpt-site inserted His6-Mmp-aCPSF1, respectively. The schematic depicting the construction of tetO-aCPSF1 and ▽aCPSF1 was shown in Supplementary Figure S1A. (B, C) Depletion of Mmp-aCPSF1 reduced 22°C-growth (B) and prolonged the bulk mRNA half-lives (C). Three batches of cultures of strains S2 and ▽aCPSF1 with or without tetracycline (Tc) were measured, and the averages and standard deviations are shown. Bulk mRNA half-lives were determined by quantifying the [3H]-uridine signal attenuation. (D) Hierarchical clustering (left) and functional category (right) analysis of the differential transcribed genes in three batches of 22°C-cultures of S2 and ▽aCPSF1. Heat plot representation of the differential expression ratio (log2) is shown with color intensity. Green and red represent the minima and maxima fold, respectively. The functional category enrichment ratio (a bar with gradient red intensity at lower right corner) was percentages of the up (orange)- and down (green)-regulated gene numbers (horizontal axis) in total genes of each arCOG categories (Supplementary Table S4). The significance statistical analysis was analyzed by Fisher's exact test with Benjamini-Hochberg multiple-testing correction to calculate P-values for each function category, and ** and * respectively mark the significant enriched categories with P < 0.01 and < 0.05 (Supplementary Table S4). (E) Hierarchical grouping of the differential transcribed genes caused by Mmp-aCPSF1 depletion. Based on the FPKMs in strain S2, transcripts were grouped into five ranks (<42, 43–103, 104–214, 215–573 and >573 of FPKMs), and then the up- and down-regulated and unchanged transcript numbers in each rank in ▽aCPSF1 were counted. (F) According to the gene essentiality in M. maripaludis defined by Sarmiento et al. (29), percentages of essential and non-essential genes falling in the up- and down-regulated and unchanged groups in ▽aCPSF1 were calculated, respectively.

