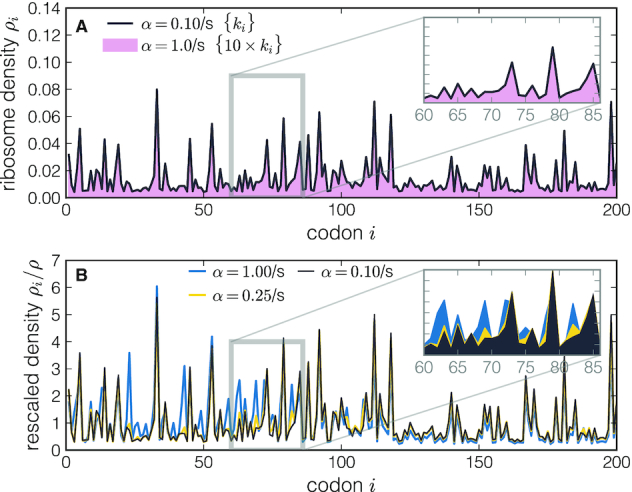
Figure 2.

in silico density profiles. In panel (A), the black line shows the density profile obtained from the stochastic simulation of a transcript with a speed profile {ki} and initiation rate α = 0.1/s. The shadowed region corresponds to the profile of a transcript simulated with a 10-fold larger initiation rate, but keeping {κi} constant (i.e. also increasing the elongation rates by a factor 10). This shows that densities obtained with the same elongation-to-initiation ratios {κi} are indistinguishable. In panel (B), we fix the speed profile {ki} for three different values of the initiation rate α and we plot the rescaled profiles ρi/ρ. As expected, by increasing the initiation rate we obtain different profiles with increasing density and traffic effects.
