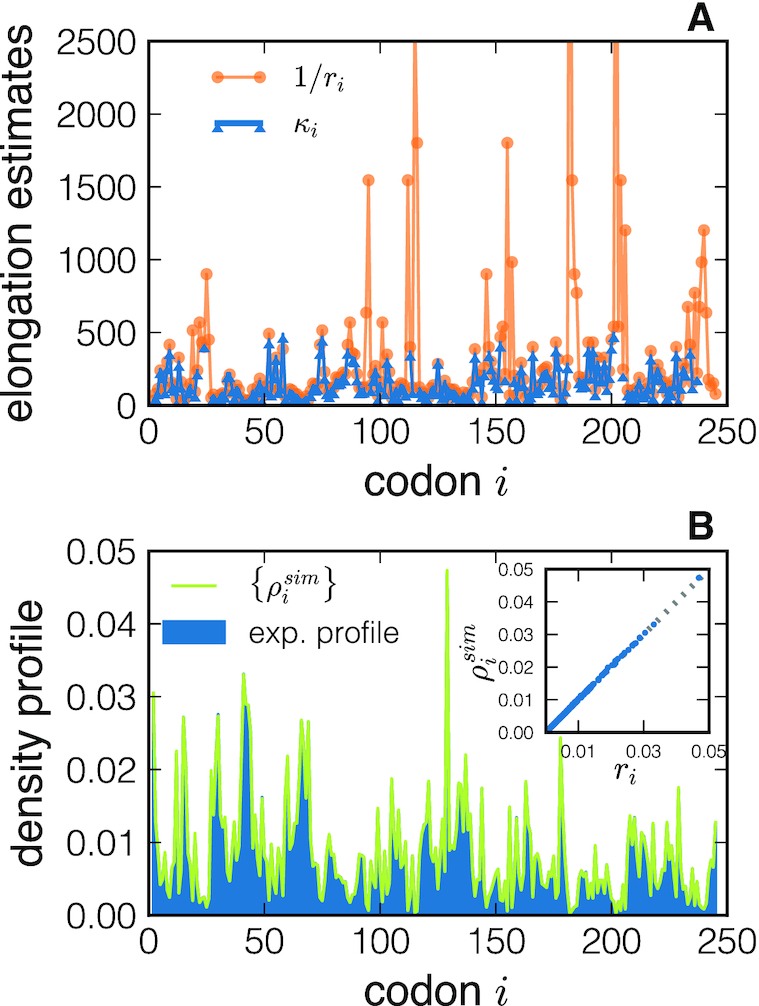
Figure 3.

Results of NEAR applied to the YLR301W gene. (A) The optimized profile {κi} is plotted (triangle markers) as a function of the codon position i, and compared to the naive estimates {1/ri} (round marker). In panel (B), we compare the model-predicted density profile obtained using the inferred {κi} (lighter line) with the experimental normalized profile {ri}. The inset shows the scatter plot between the two densities (for each codon i) demonstrating an excellent agreement between theory and experiments.
