Figure 4.

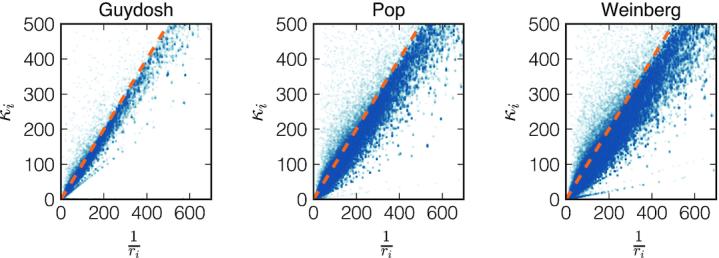
Scatter plot of the elongation-to-initiation κi for each codon that passed the quality check versus the inverse of the experimental density 1/ri for the Guydosh, Pop and Weinberg datasets. The dashed line corresponds to the bisect.

Scatter plot of the elongation-to-initiation κi for each codon that passed the quality check versus the inverse of the experimental density 1/ri for the Guydosh, Pop and Weinberg datasets. The dashed line corresponds to the bisect.