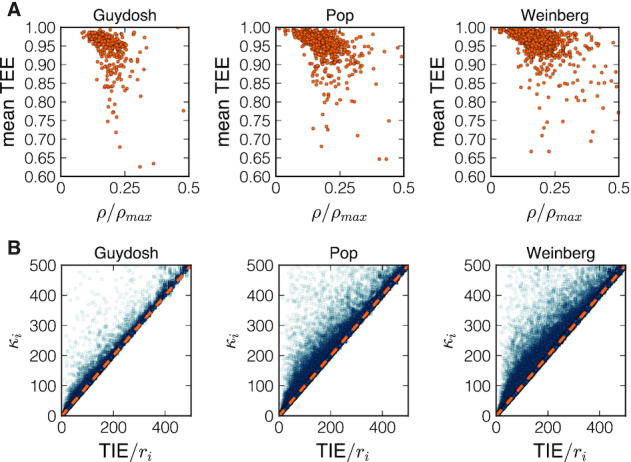
Figure 7.

In the first row (A) we show the ribosome density ρ normalized with the maximal density ρmax versus the mean value of TEE along the transcript. In the second raw (B) we plot TIE/ri versus κi to emphasize the extent of traffic in determining the ribosome’s dwelling time. The orange dashed line is the bisect TIE/ri = κi (no traffic). Codons far from that line are the ones more impacted by ribosome interference.
