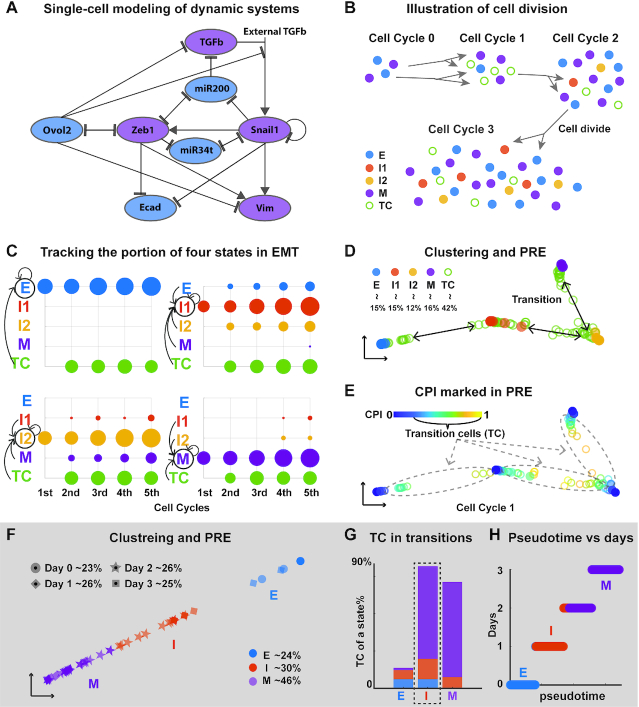
Figure 2.
Testing QuanTC on simulated EMT datasets and a qPCR dataset for hepatic differentiation of hESCs. (A) The EMT gene regulatory network used in the multi-scale agent-based model; blue: epithelial promoting factor; purple: mesenchymal promoting factor. (B) Illustration of the modeling output: each cell colored by its true state labels. (C) A simulation dataset: the proportion of each state induced by the previous cell states at the end of each cell cycle. The size of the dot is proportional to the number of cells, and the color denotes the cell states of the mother cell. The arrows represent the occurred state transitions and the circle represents the state of the daughter cell. It shows the transition dynamics of each state. (D, E) PRE visualization of each cell at the end of first cell cycle (a circle) colored by its true state from the model (D) and the calculated CPI value (E). The percentage for each cell type is the percentage of a given cell type over the entire cell population size. (F) Clustering and PRE visualization of the qPCR dataset. Each dot represents one cell colored by the identified state, and its shape represents its real time. (G) Percentage of TC in each state relative to the total number of TC with colors consistent with (F). Dashed box: the intermediate cell state. (H) Comparison of the inferred pseudotime and the day collected in the experiment of each cell. The parameters are provided in Supplementary Table S1.

