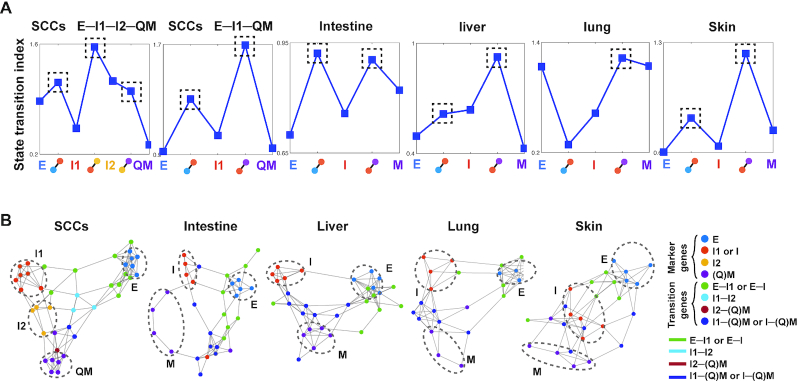
Figure 5.
State transition index and gene regulatory networks for five EMT datasets and their comparisons with QuanTC outputs. (A) State transition index of relatively stable cells in each state and the TC between states. Dashed box: TC with high value of state transition index. (B) Gene regulatory networks of top marker genes and transition genes using the PIDC algorithm from the SCC and mouse embryonic development datasets (the top ∼80% of edges are shown). The parameters are given in Supplementary Table S1. Each dot represents a gene colored by its type. Each large dashed circle labels marker genes of a particular cell state. Graph edges indicate the top interactions and the length of the edge is inversely proportional to the interaction strength between genes.

