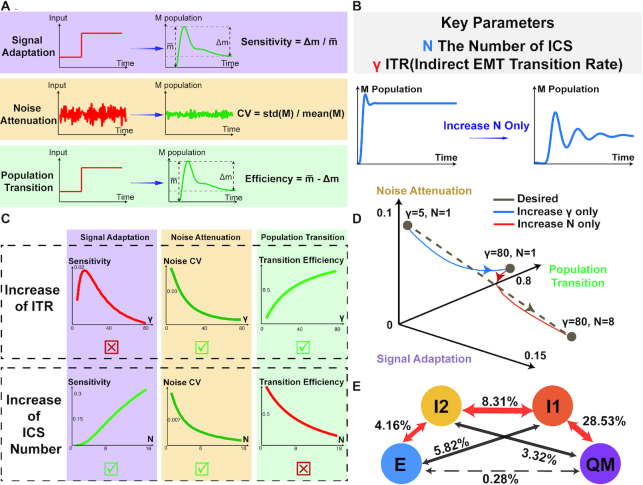
Figure 6.
Dynamical properties of inferred ICS-regulated EMT trajectories. (A) The definitions and measurements of three quantities – adaptation, noise attenuation and population transition properties of cell population dynamics. (B) The key parameters of model including ICS number N and ITR gamma (see also Materials and Methods, Supplementary Figure S3). Increase of ICS number N can result in the multiple peaks in M population trajectory, forming the oscillatory adaptation. (C) Effect of tuning N and gamma on the three quantities (see also Supplementary Figure S3). (top row) Changes in three quantities by fixing N = 2 and tuning gamma from 5 to 80. The increase in ITR gamma lowers the noise coefficient of variance (CV) of output M population, and increases the transition efficiency from E to M. The signal adaptation sensitivity is not a monotonic function of gamma, which reaches the peak before a certain threshold and declines afterwards with further increase in gamma. (bottom row) Change of three quantities by fixing gamma and tuning N from 1 to 18. The increase in N improves adaptation sensitivity and noise attenuation, however reducing the value of transition efficiency. (D) Tuning parameter gamma and N separately cannot achieve all the desired properties (i.e. simultaneous increase of adaptation sensitivity, noise attenuation and EMT efficiency, indicated by brown dashed line). The desired properties can be achieved by increasing ITR gamma (blue line, increase gamma from 5 to 80 and fix N as 1) first and increasing N subsequently (red line, increase N from 1 to 8 and fix gamma as 80). (E) EMT trajectories inferred from SCC dataset, with node colors consistent with Figure 3. Other inferred trajectories are shown in Supplementary Figures S12–S13. The arrow represents potential transition between states, and number represents the percentage of TC. The red arrows indicate the major transition trajectory mediated by ICS, and the dashed arrow refers to the direct transition route from E to QM state.

