Figure 6.
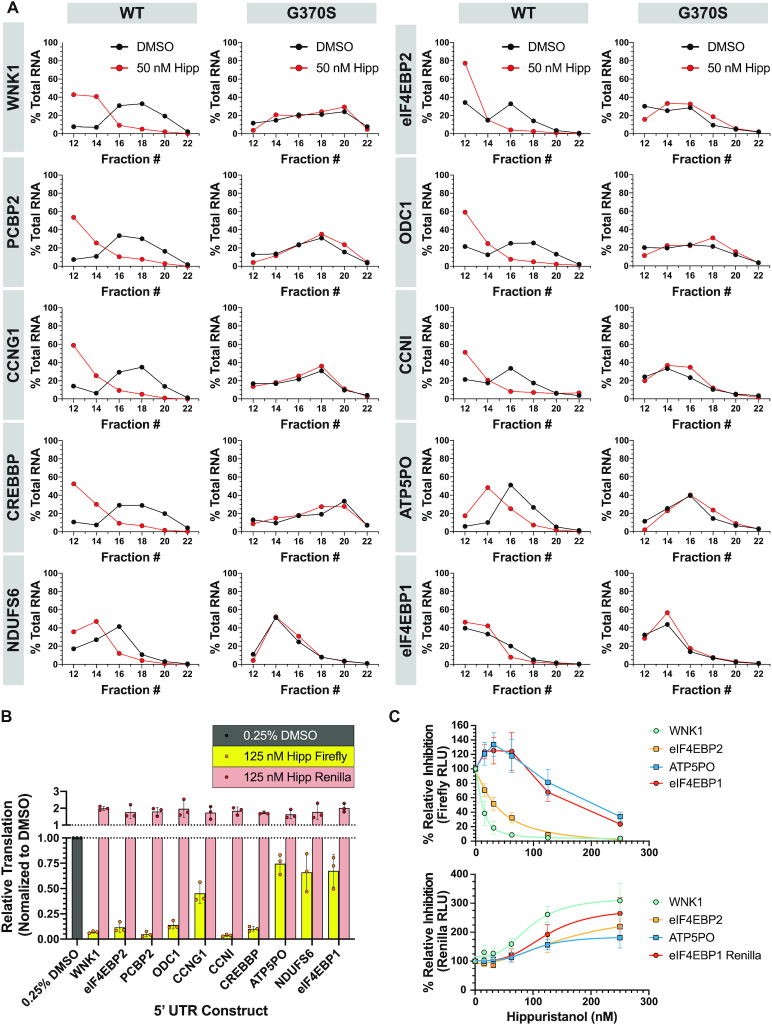
Validation of Hipp-responsive transcripts in Hap1 cells. (A) Polysome analysis of select Hipp -sensitive transcripts. Polysome fractions (#12–22, every 2nd fraction analyzed) from 50 nM Hipp- or DMSO-treated Hap1 or G370S cells were probed for the abundance of the indicated mRNAs. Data are presented as the mean values of two biological replicates. Note that fractions at the top of the gradient (#1–11) which include free RNA and ribosomes were not included in the analysis since the RNA in these tend to be degraded. (B) Luciferase expression data from reporters harboring the 5′ leader region of select Hipp-responsive mRNAs. HEK-293T/17 cells were transfected with m7G-capped bicistronic mRNA, then 1 h later exposed to 125 nM Hipp for 7 h, at which point cells were harvested and luciferase values measured. n = 3 ± SD. (C) In cellula dose-response of the indicated reporters to Hipp. n = 3 ± SD.

