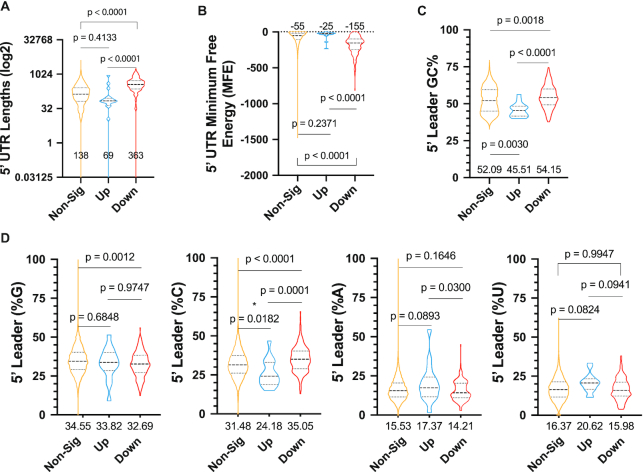
Figure 7.
Characterization of Hipp-sensitive transcripts. (A) Lengths of the 5′ leader regions of each group: non-significant (Padj ≥ 0.05, 10442 genes), up-regulated (log2 fold change > 0, 18 genes), and down-regulated (log2 fold change < 0, 185 genes) are shown with median lengths displayed. A one-way ANOVA with Tukey's multiple comparison test was used to calculate the P-values shown. (B) The non-normalized minimum free energy (MFE) of the 5′ UTRs of each group is shown along with the median values and P-values from a one-way ANOVA with Tukey's multiple comparison test. (C) The %GC composition of the 5′ leader region of each group with median values shown beneath each plot. A one-way ANOVA with Tukey's multiple comparison test was used to calculate P-values. (D) Nucleoside base compositions of the 5′ leader regions of each group are represented as percentages. Median values are displayed beneath each data set. Tukey's multiple comparison test was used to calculate P-values.

