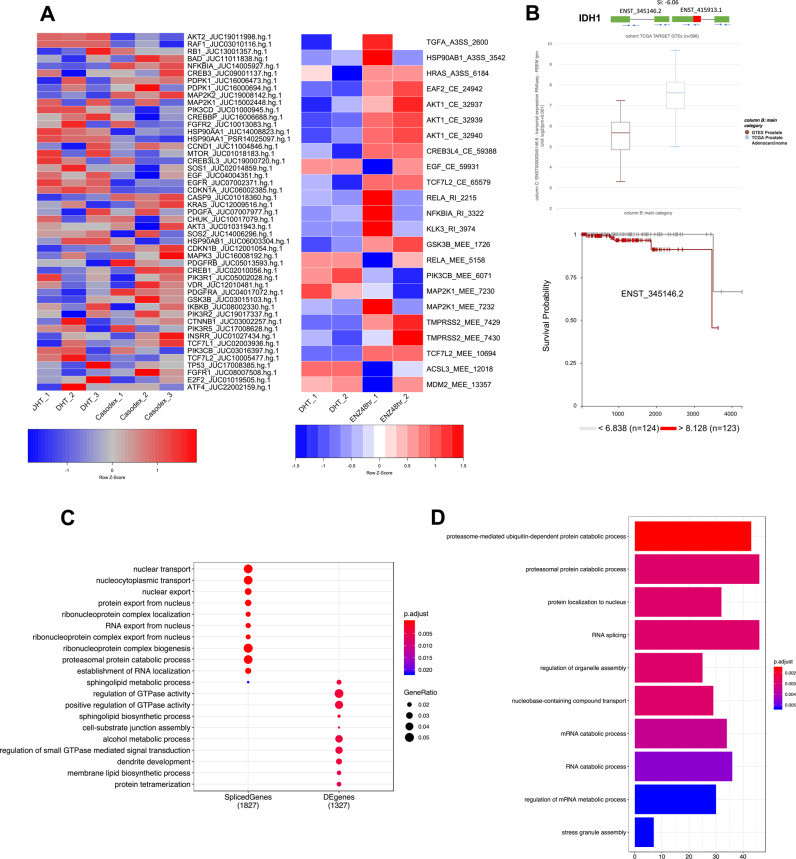
Fig. 2. Functional analysis of genes regulated at the level of alternative splicing and transcription in prostate cancer cells.
a Heatmap showing the differential percent splice index (PSI) of prostate-cancer-relevant genes between LNCaP cells cultured with 10-μM casodex and 10-nM DHT. The adjacent heatmap shows the PSI across different conditions including LNCaP cells treated with DHT or enzalutamide. b Functional validation for the casodex-mediated switch in the IDH1 isoform expression. The box plot comparing the expression of the ENST00000345146 or ENST00000415913 between TCGA-prostate adenocarcinoma tissue and GTEX-normal prostate tissue. The Kaplan–Meier plot displays the association between expression of ENST00000345146 and survival for patients with prostate cancer. c A dot plot comparing GO pathways enriched in differentially expressed or alternatively spliced genes modulated by casodex and DHT. d A bar plot showing GO pathways enriched in genes modulated by enzalutamide in comparison to DHT.

