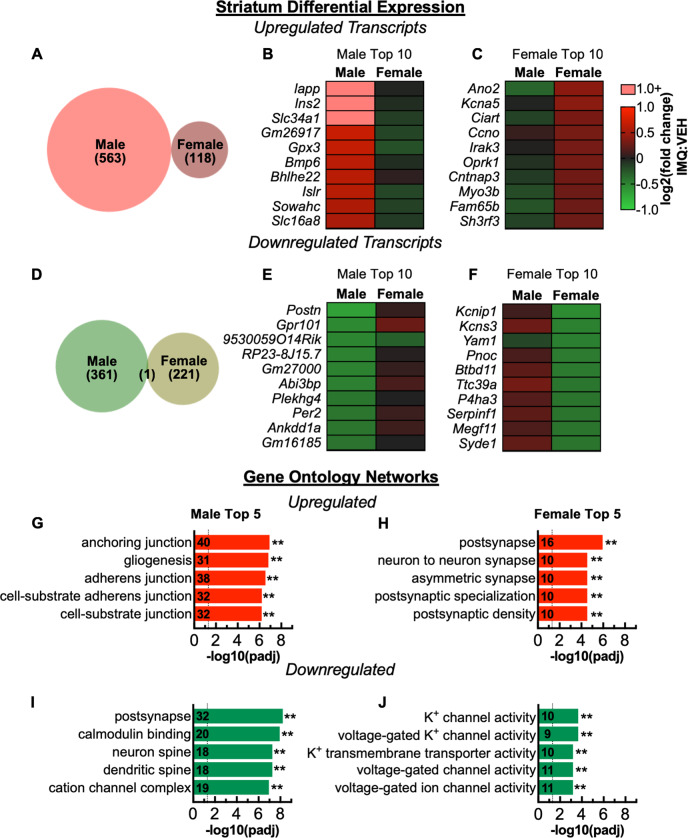
Fig. 5.
Prenatal TLR7 activation leads to a divergent molecular signature in the dorsal striatum between males and females. a–f Differentially expressed genes following prenatal TLR7 activation. a Proportional Venn diagram of number of significantly upregulated genes showing no overlap between males and females. b Top 10 (by fold change) significantly upregulated transcripts in males and (c) in females. d Proportional Venn diagram of significantly downregulated genes showing minimal overlap between males and females. e Top 10 significantly downregulated transcripts in males and (f) in females. g–j Enriched gene ontology (GO) networks. g GO enrichment of upregulated transcripts in males and (h) females. i GO enrichment of downregulated transcripts in males and (j) females. **P < 0.01

