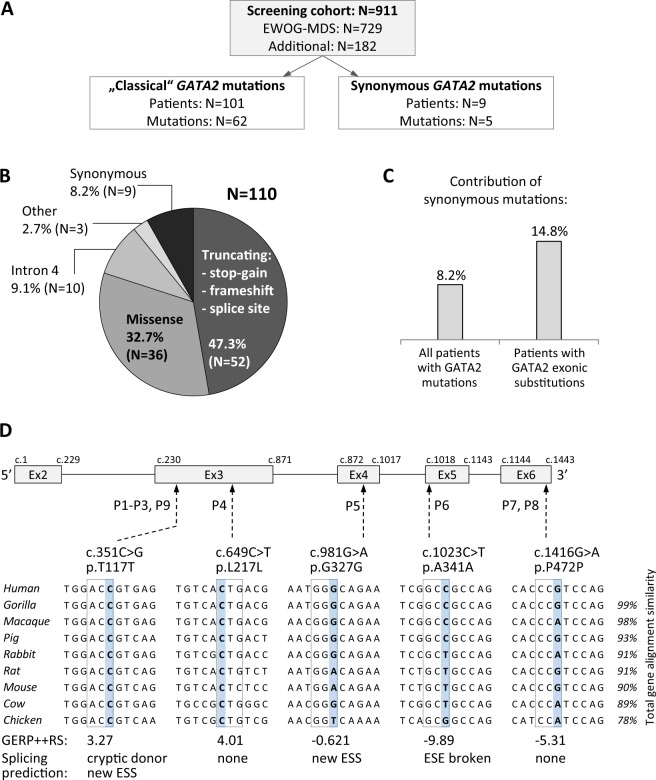
Fig. 1. Composition and genetics of the study cohort.
a Flow diagram depicts the screening cohort and GATA2 mutations identified. b Overall distribution of genotypes among 110 patients with GATA2 deficiency. Truncating variants are localized prior to or within zinc finger 2; missense mutations cluster mainly to zinc finger 2 region; intron 4 mutations affect the EBOX-GATA-ETS regulatory region (+9.5 kb) of GATA2; other: one in-frame deletion and two whole gene deletions; synonymous variants are proposed as a new group of pathogenic GATA2 mutations. Numbers in parentheses refer to individual patients. c Frequency of patients with synonymous mutations among all GATA2 positive cases and among the group of patients carrying exonic substitutions. d Schematic representation of the GATA2 gene (NM_032638.4) with synonymous variants identified. Affected nucleotide is shaded blue and dashed line boxes indicate respective codon triplet. Nucleotide conservation is presented for nine species. Evolutionary conservation is depicted on the bottom as Genomic Evolutionary Rate Profiling (GERP + + RS) score with values ranging from −12.36 to 6.18, and 6.18 being the most conserved. Splicing prediction was performed with Human Splicing Finder v.3.0. ESS exonic splicing silencer, ESE exonic splicing enhancer.

