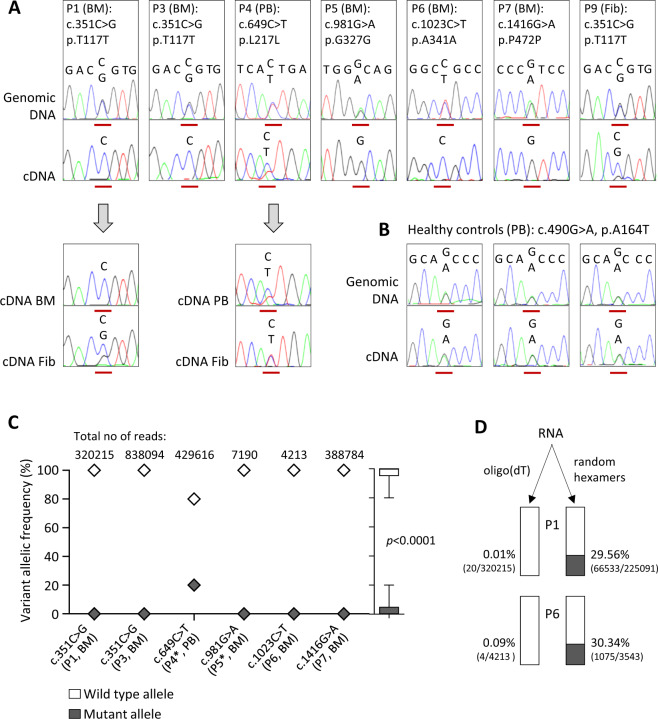
Fig. 2. Sequencing analysis of patients with synonymous GATA2 mutations.
a Upper panel: Representative electropherograms with genomic and cDNA sequence surrounding the affected nucleotide (red line). All five distinct synonymous mutations are represented. Lower panel: Comparison of allelic expression in the hematopoietic and nonhematopoietic tissue of P1 and P4. b Genetic testing of healthy controls carrying a common nonsynonymous GATA2 polymorphism c.490G>A (19.5% minor allele frequency in gnomAD). c Allelic frequency of GATA2 alleles determined by targeted deep sequencing of patients’ cDNA; numbers of reads taken from one representative replicate. In all cases oligo(dT) priming was used with exception of P4 and P5 (*) where the mixture of random hexamers and oligo(dT) was utilized. Outside right: Boxplot depicts combined allelic contribution in all patients. Calculation of p value was performed using Student’s t test (mean ± SD values). d Frequency of mutated alleles determined by deep sequencing of cDNA obtained from bone marrow RNA using two different reverse transcription priming methods. Mutant vs. total read counts are shown in parentheses, and percentage represents the proportion of mutated alleles in the sample. BM bone marrow, Fib fibroblasts, PB peripheral blood.

