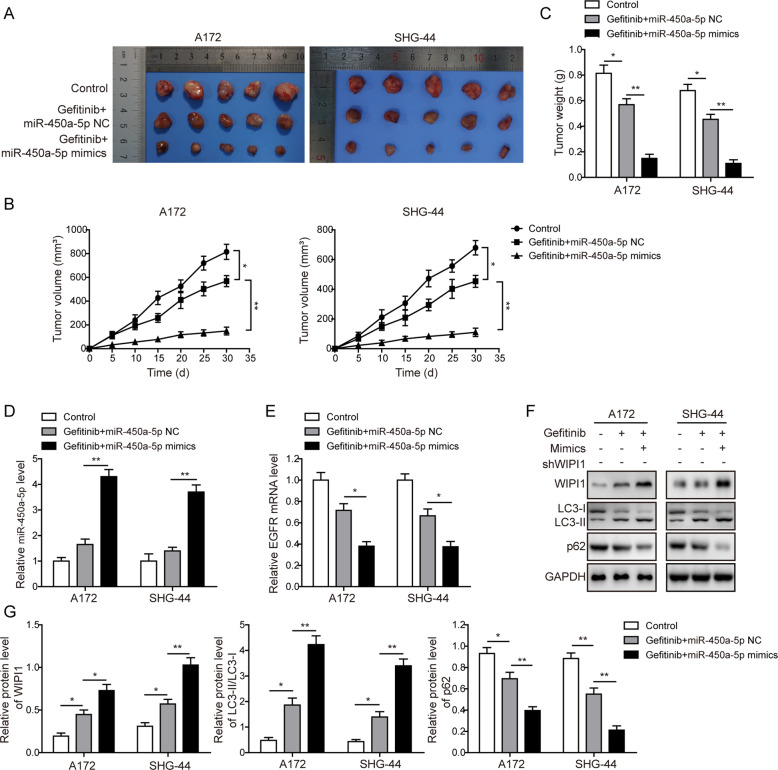
Fig. 7. Effects of miR-450a-5p overexpression on the glioma tumorigenesis in subcutaneous model.
a Tumor samples from differently treated mice. b Tumor volumes among different groups. c Tumor weights among different groups. d The expression level of miR-450a-5p among different tumor samples determined by qRT-PCR. e The expression level of EGFR among different tumor samples determined by qRT-PCR. f The expression levels of autophagy-related proteins among different tumor samples detected by Western blot analysis. g Quantitative analysis of the Western blot results. For subcutaneous xenograft model, 200 μL of cell suspension (about 1 × 10⁷) in PBS was subcutaneously injected into the nude mice. Tumor sizes were measured every 5 days with electronic caliper for 30 days. Tumor volume (V) was calculated by the formula: V = 0.5 × length × width2. The result was a representative of three independent experiments. Note: Error bars represented mean ± SD. p values were determined by one-way analysis of variance (ANOVA) followed by Tukey post hoc test. **p < 0.01 and *p < 0.05.

