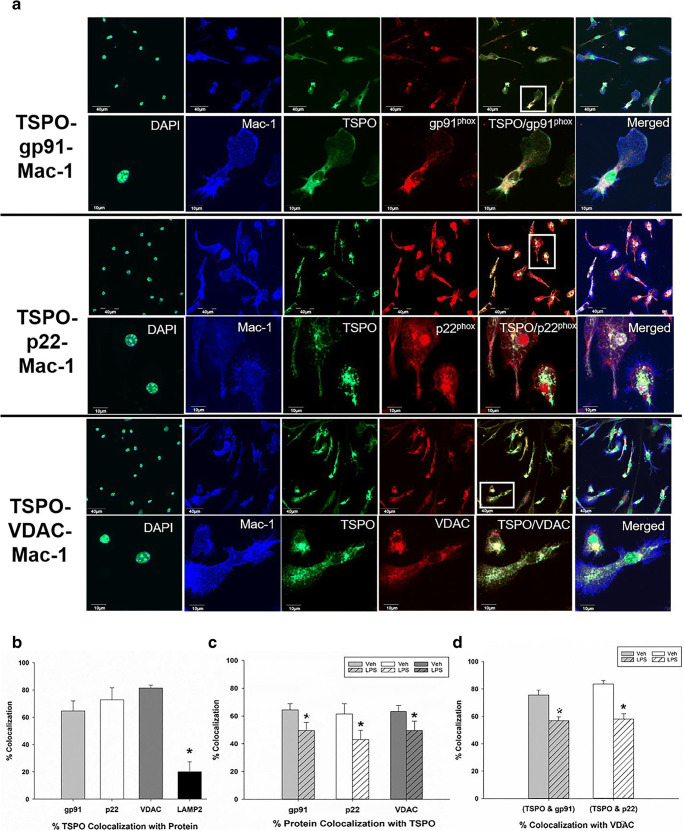
Fig. 2.
Immunocytochemistry and confocal imaging of TSPO colocalization with gp91phox, p22phox, VDAC, and LAMP-2 and effect of LPS activation in primary microglia. a Triple-label immunofluorescent confocal images of TSPO colocalization with gp91phox, p22phox, or VDAC in primary microglia (Mac-1 labeled) cells. Confocal images show that TSPO colocalizes with gp91phox, p22phox, and VDAC in primary microglia. Images in upper panels are at a low magnification: scale bar = 40 μm. Cells in white boxes were selected to be expressed at a higher magnification: scale bar = 10 μm (lower panel). b Analyses of protein pair signal colocalization revealed that TSPO has a high degree of colocalization with gp91phox (64.68%), p22phox (72.82%), and VDAC (81.48%) and a lower level of colocalization (20.13%) with the lysosomal marker, LAMP-2 in vehicle-treated microglia. Analysis of variance with Tukey’s post hoc tests shows a significant effect of protein colocalization with TSPO (F3,6 = 9.8; p = 0.0006) where TSPO colocalization with LAMP-2 is significantly lower than with gp91phox, p22phox, and VDAC (* = p < 0.01). c The percentage of gp91phox, p22phox, and VDAC that colocalized with TSPO decreased when microglia were activated with 100 ng/mL of LPS for 18 h relative to vehicle conditions (% gp91 with TSPO: p = 0.004; %p22 with TSPO: p = 0.002; % VDAC with TSPO: p = 0.003). These results indicate that microglia activation disrupts TSPO’s association with gp91phox, p22phox, and VDAC. d Further analysis of signal colocalization indicates that under LPS-stimulated conditions, TSPO associated with gp91 and TSPO associated with p22, exhibit significantly decreased colocalization with VDAC suggesting a movement from the mitochondria to other cellular compartments (% (TSPO with gp91)/ VDAC: p < 0.001. % (TSPO with p22) / VDAC: p = 0.004). Data are expressed as mean ± s.e.m. n = 5–7 independent experiments with > 35 microglia counted per treatment condition per experiment. n = 3 independent experiments for TSPO/LAMP-2 labeling with > 35 microglia counted per treatment condition per experiment. Student’s paired t test was performed; *p < 0.05 compared to vehicle-treated microglia

