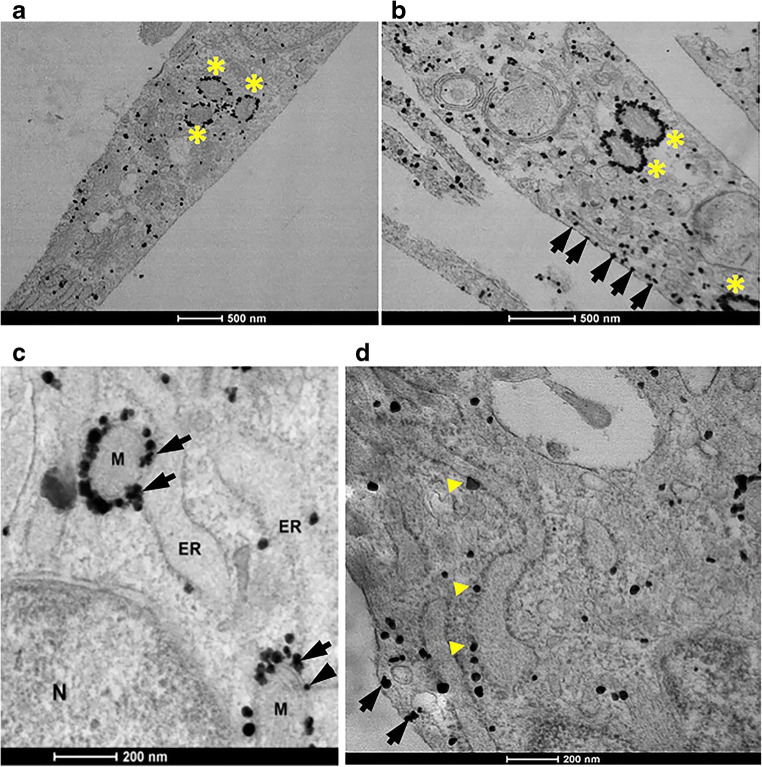
Fig. 4.
Immuno-gold electron microscopy of TSPO in primary microglia. a Immuno-gold electron microscopy of TSPO in vehicle-treated microglia confirms a high level of TSPO expression in mitochondria (yellow stars). Black dots = TSPO. b TSPO expression in microglia activated with LPS (100 ng/mL) for 18 h. There is an apparent increase in TSPO expression. TSPO labeling is seen at the mitochondria, as well as other subcellular compartments including at or just below the plasma membrane (black arrows). c High magnification imaging of TSPO expression in non-activated microglia indicates TSPO localization in the endoplasmic reticulum (ER) and at the mitochondria-associated ER membrane or MAM (black arrows). N = nucleus; M = mitochondria; ER = endoplasmic reticulum. d High magnification imaging of TSPO expression in non-activated microglia shows TSPO localization at the ER (yellow triangles) and at or just below the plasma membrane (black arrows)

