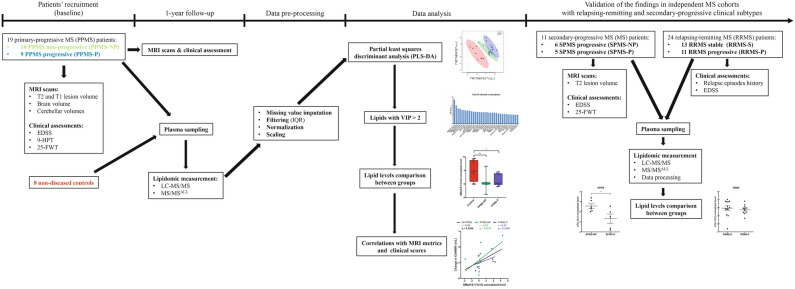
Figure 1.
Flow chart of study procedures. The figure shows the overall study design. From left to right: recruitment of PPMS patients in the discovery cohort, MRI and clinical assessment at baseline, and MRI evaluation, clinical assessment and plasma collection at the one year follow up. Plasma samples were then subjected to LC–MS/MS and MS/MSALL, followed by lipidomic data pre-processing. The PLS-DA was used to identify lipids driving separations between groups and those with a high VIP score (> 2.0) were evaluated further with statistical tests to identify differentially abundant lipids correlating with rapid disease progression. Two independently collected plasma lipidomic datasets from two distinct cohorts of SPMS and RRMS patients were similarly analyzed to validate the findings in PPMS patients also in the relapsing–remitting and secondary-progressive MS clinical subtypes.

