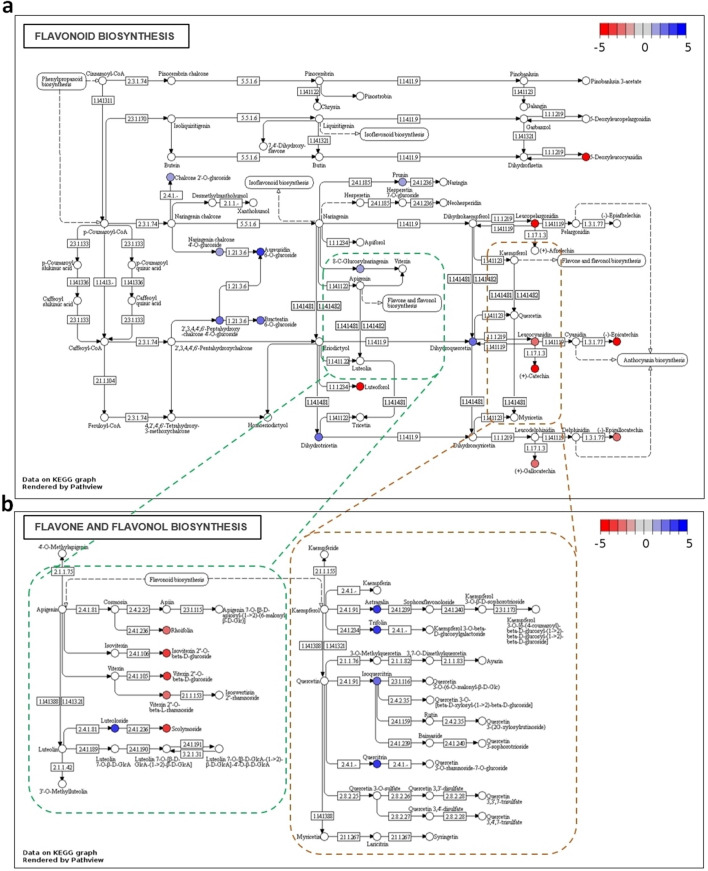
Figure 3.
Flavonoid (a) and Flavone and flavonol (b) biosynthesis pathways from V. vinifera showing the discriminatory putative metabolites between resistant/partial resistant and susceptible groups (FDR corrected p-value < 0.01). Metabolite’s KEGG identifiers were used in the R package Pathview, coloured in agreement with their |log2(FC)| values, between resistant/partial resistant and susceptible plants: more accumulated in the resistance/tolerance group are blue, more accumulated in the susceptibility group are red and those unchanged are grey, setting the limits between − 5 and 5.

