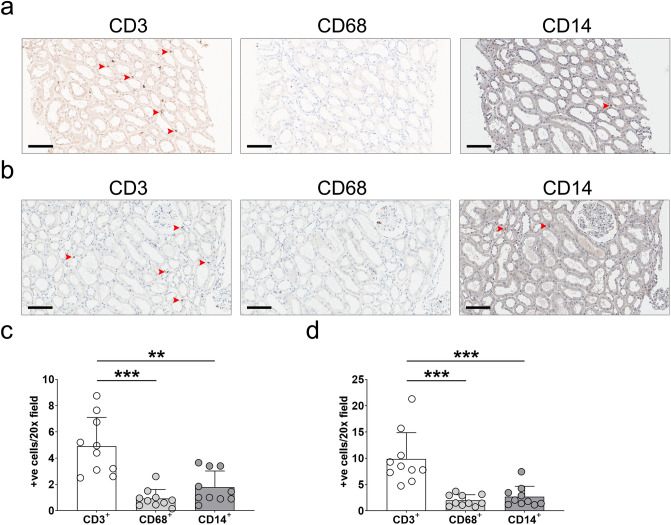
Figure 3.
Immunostaining analysis of human kidney sections. (a) Representative images of staining for CD3, CD68, and CD14 in healthy kidney donors (n = 10). Scale bar = 10 μm. (b) Quantitative analysis of CD3+, CD68+, and CD14+ cells in sections from healthy kidney donors. (c) Representative images of staining for CD3, CD68, and CD14 in subjects without specific renal lesions (n = 10). Scale bar = 10 μm. (d) Quantitative analysis of CD3+, CD68+, and CD14+ cells in sections from subjects without specific lesions. Arrows indicate representative positive cells. **P < 0.01; ***P < 0.001.

