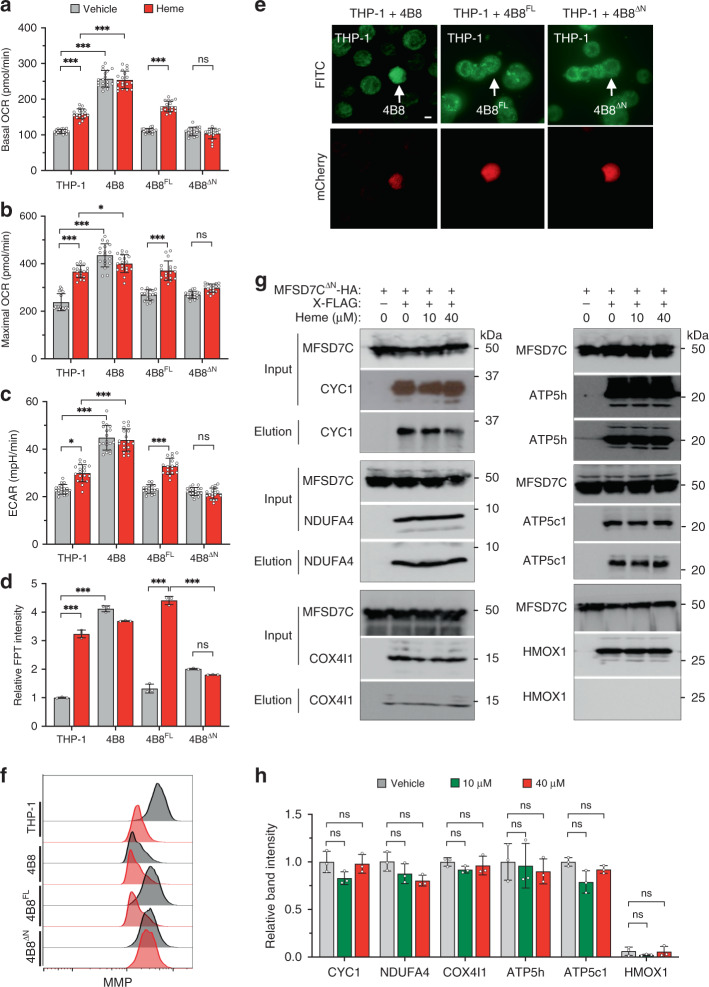
Fig. 4. NTD of MFSD7C mediates heme effect on mitochondrial respiration.
a–c Comparison of basal OCR (a), maximal OCR (b), and ECAR (c) of THP-1, 4B8, and 4B8FL, and 4B8ΔN cells treated with vehicle or heme for 1 h (n = 18 separate experiments). d Comparison of FPT intensity of THP-1, 4B8, 4B8FL, and 4B8ΔN cells. Cells were incubated with FPT for 6 h, washed and reseeded in poly-lysine coated glass bottom dishes. After cells attached to the glass, medium containing 40 μM heme was added. Cells in the same field were imaged immediately and again 1 h later. Relative FPT fluorescent intensities, normalized to THP-1, from three experiments are shown. Representative images are shown in Supplementary Fig. 9e. (n = 3 independent experiments). e Restoration of thermogenesis in 7CKO cells by expression of MFSD7CFL and MFSD7CΔN. THP-1 cells were co-cultured with 4B8, 4B8FL, or 4B8ΔN in FPT solution for 6 h, washed and reseeded in poly-lysine coated glass bottom dishes. Cells were imaged by confocal laser-scanning microscopy. Green channel shows the FPT intensity and the red channel (mCherry) distinguishes knockout cells from the parental THP-1 cells. Representative images from three experiments are shown. Scale bar: 10 µm. f Heme treatment reduces MMP in 4B8 cells complemented with MFSD7CFL but not MFSD7CΔN. THP-1, 4B8, 4B8FL, and 4B8ΔN cells were treated with vehicle or heme for 1 h and MMP was measured by using JC-10 Mitochondrial Membrane Potential Assay Kit followed by flow cytometry. Representative mitochondrial staining profiles from three experiments are shown. g and h Heme does not disrupt MFSD7CΔN interactions with ETC components. Co-IP was performed as in Fig. 2k, except HA-tagged MFSD7CΔN was used. Shown are representative Western blotting data (g) and quantification of band intensities from n = 3 independent experiments (h). p values were calculated using two-way ANOVA (*p < 0.05, **p < 0.01, ***p < 0.005). Data are presented as mean value ± standard deviation.

