
Fig. 4.
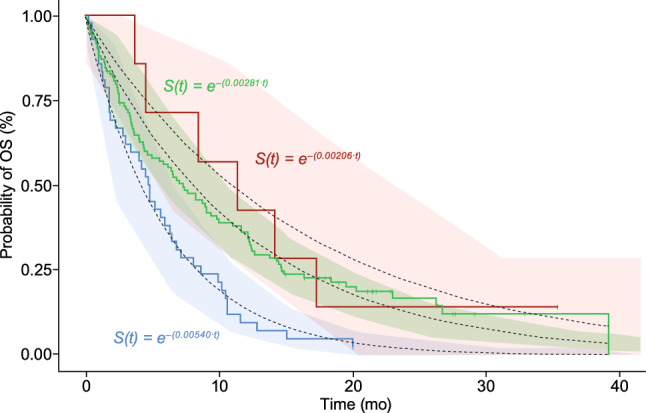
Exploratory treatment–response analysis including glasdegib + decitabine treatment. The black dotted lines represent the survival functions, S(t) from the exploratory treatment–response final model with the 95% confidence interval of the predicted survival function in the shaded area by treatment arm. The solid lines are the observed OS data from the glasdegib + decitabine (pink), glasdegib + LDAC (green), and LDAC alone (blue) treatment arms. LDAC low-dose cytarabine, OS overall survival, S(t) probability of survival