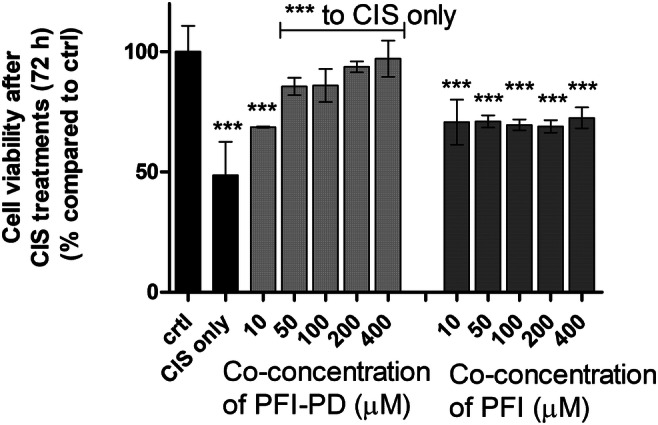
Fig. 4.

The cell viability of MCF-7 cells after 72 h incubation of cisplatin (100 μM) or co-treatment of 10–400 μM LAT1-utilizing prodrug (PFI-PD) (light gray bars) or perforin inhibitor (PFI) (dark gray bars) together with 100 μM cisplatin. The data are presented as percentages (%) of the treatment groups compared with the untreated cells (ctrl) (mean ± SD, n = 3–6). An asterisk denotes a statistically significant difference from the respective control or the cisplatin-induced group (indicated with a separate line) (*** P < 0.001, one-way ANOVA, followed by Tukey’s test)
