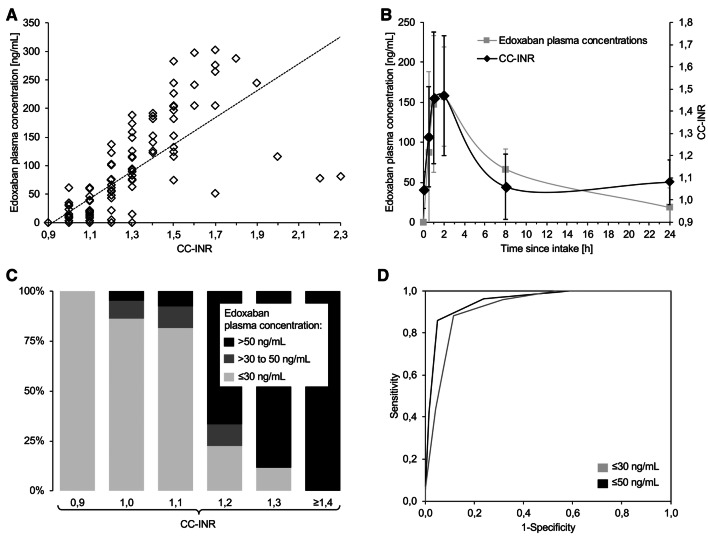
Fig. 1.
a Correlation of CoaguChek®-international normalized ratio (CC-INR) values and edoxaban plasma concentrations (dashed line: regression line), b changes in edoxaban plasma concentrations and CC-INR results over the course of the study period (displayed as mean ± one standard deviation), c percentage of edoxaban plasma concentrations below and above the treatment-relevant thresholds of 30 and 50 ng/mL found at different CC-INR levels, and d receiver operating characteristics curve found for CC-INR when testing for detection of samples containing edoxaban plasma concentrations ≤ 30 and ≤ 50 ng/mL

