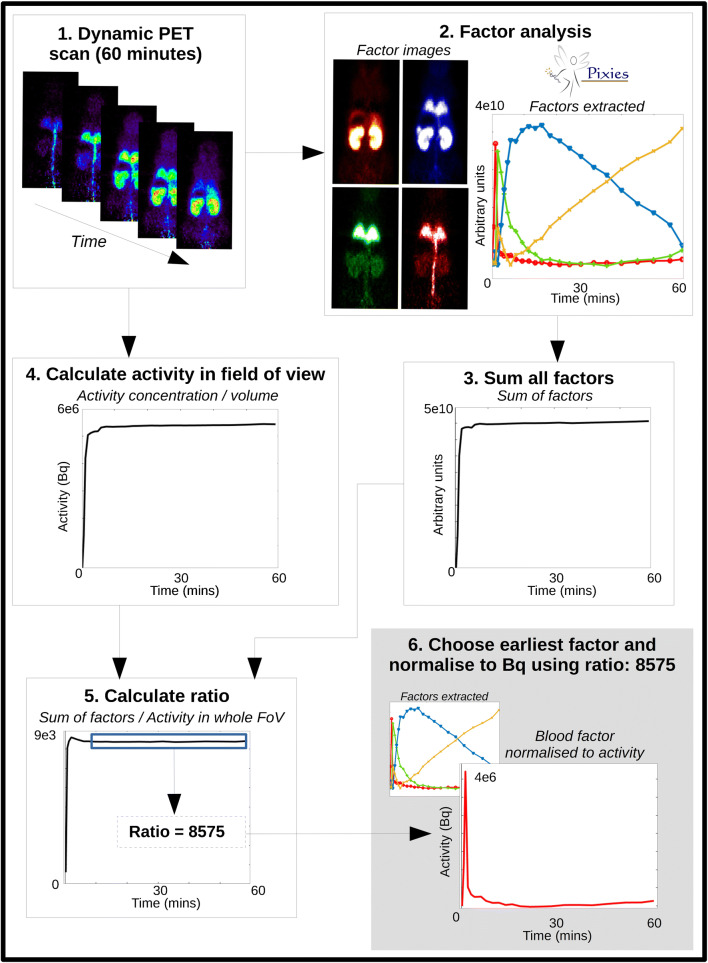
Fig. 1.
Process for extracting the IDIF from the dynamic PET scan: (1) the whole-body dynamic PET captures all activity; (2) FA is run with 3 (presaturation) or 4 (tracer dose) factors – the factor curves are shown along with their corresponding spatial distribution and relative intensity. The curve with the earliest peak (in red) shows the strongest signal in the expected regions for blood (tail vein, aorta, lungs); (3) all factors are summed together; (4) the whole-body TAC is obtained from a ROI placed around the whole body, and the total activity in Bq is calculated from the measured activity concentration (Bq/cc) multiplied by ROI volume; (5) the ratio between the summed factors and the whole-body TAC is calculated and the average of the ratio from 10 min onwards is calculated; (6) the blood factor curve is normalized to Bq using the average ratio value. This IDIF is then metabolite corrected and used in the image processing and parameter estimation

