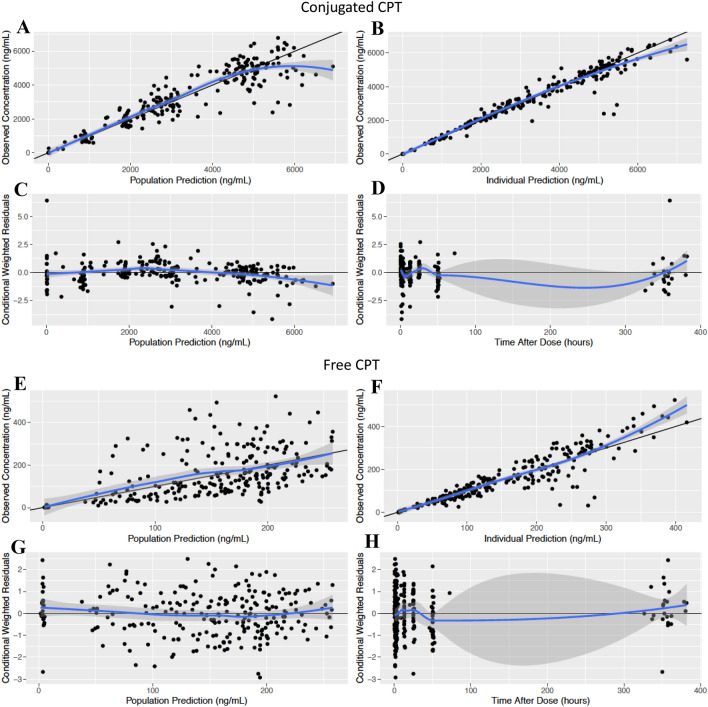
Fig. 2.
Goodness-of-fit plots for the pharmacokinetic model. Separate plots were generated for the evaluation of conjugated CPT (a–d) and free CPT (e–h). Plots include population prediction against observed data (a, e), individual prediction against observed data (b, f), conditional weighted residuals against population prediction (c, g), and conditional weighted residuals against time after dose (d, h). The solid black lines represent either the line of unity (a, b, e, f) or the zero line (c, d, g, h). Solid blue lines represent the local regression fit of the values

