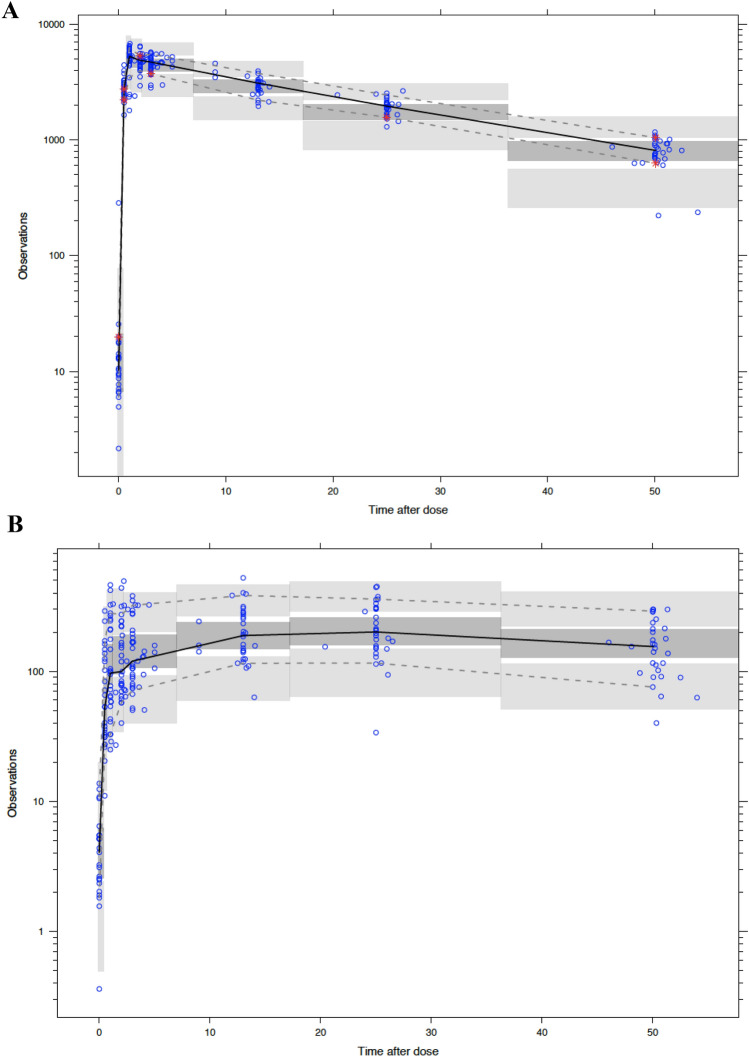
Fig. 3.
Visual predictive checks (VPCs) of conjugated (a) and free CPT (b) for timepoints up to ~ 50 h post-dose of NLG207. “Observations” are reported in units of ng/mL using log scale axis, and “time after dose” is reported in hours. Solid black lines depict the observed median and dashed lines represent the 2.5% and 97.5% percentile concentrations. 95% prediction intervals of the simulated mean and the 2.5 and 97.5% percentiles are represented by dark- and light-gray areas, respectively. Round dots represent observations and asterisks highlight observed percentiles outside of the prediction area

