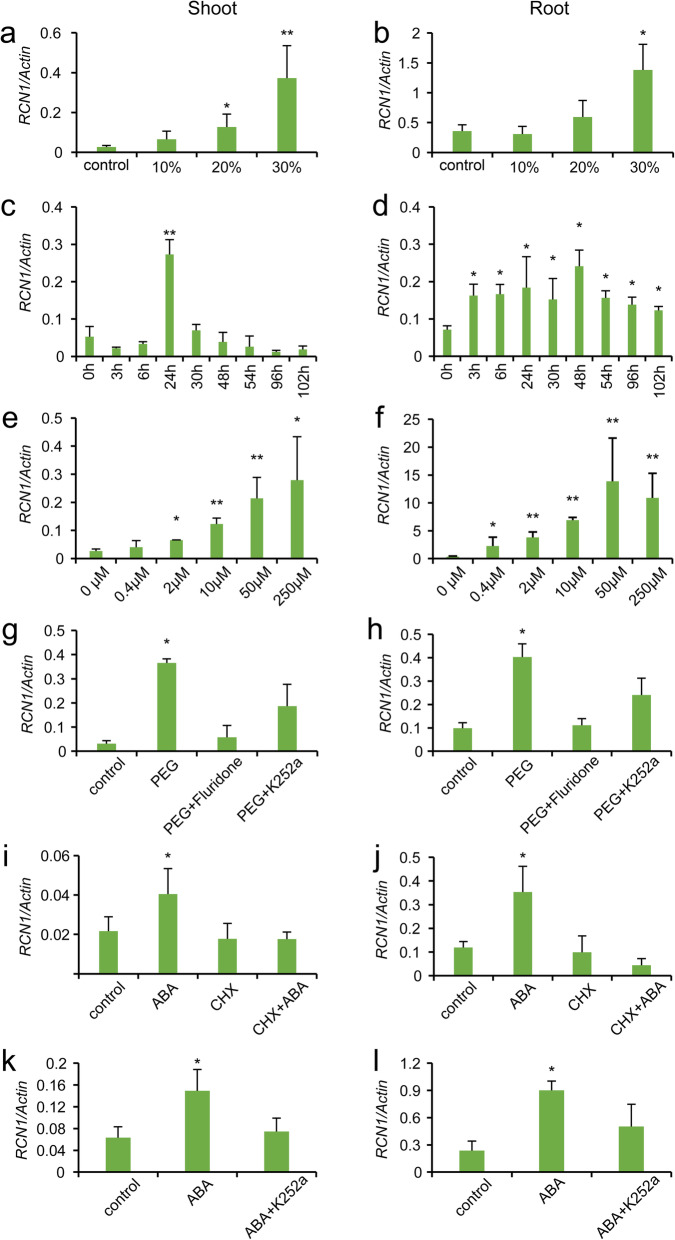
Fig. 2.
Expression levels of RCN1 in the leaves and roots under different PEG6000 treatment concentrations (a and b), different ABA treatment times (c and d), and ABA treatment concentrations (e and f). PEG6000-induced RCN1 levels in the leaves (g) and roots (h) depended on ABA synthesis and protein phosphorylation. ABA-induced RCN1 levels in the leaf (i) and root (j) depended on de novo protein synthesis. CHX: cycloheximide. ABA-induced RCN1 expression levels in the leaf (k) and (l) root depended on protein phosphorylation. Note: Statistical analysis was performed using the Student’s t test; significantly different values at P < 0.05 (*) or P < 0.01 (**) are indicated

