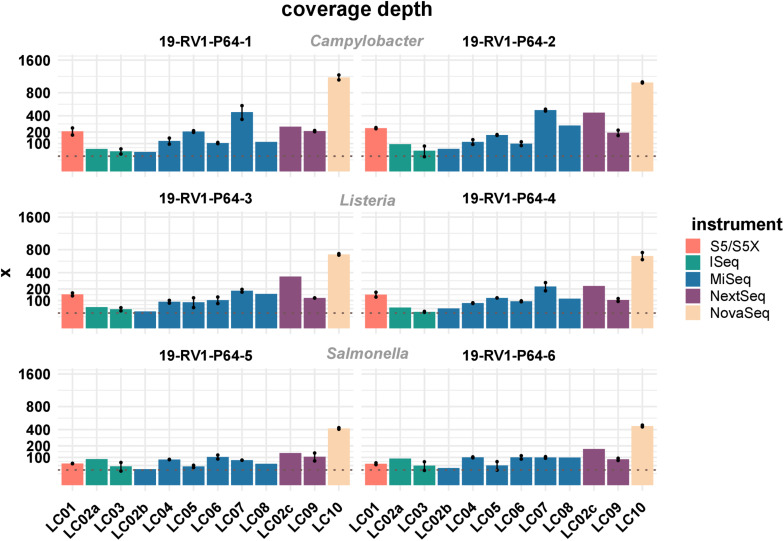
FIGURE 2.
The bar plot shows the mean coverage depth grouped by laboratories and samples. Line-connected points indicate the variance between sequencing runs (run A/run B), with the exception of laboratories LC02 and LC08 (single sequencing run). The coverage depth was defined as the sum of the length of all raw reads divided by the length of the respective PacBio reference sequence. Fill colors identify the sequencing instrument. The species of the samples is indicated. The y-axis is squared. The dotted line marks a coverage depth of 30×.

