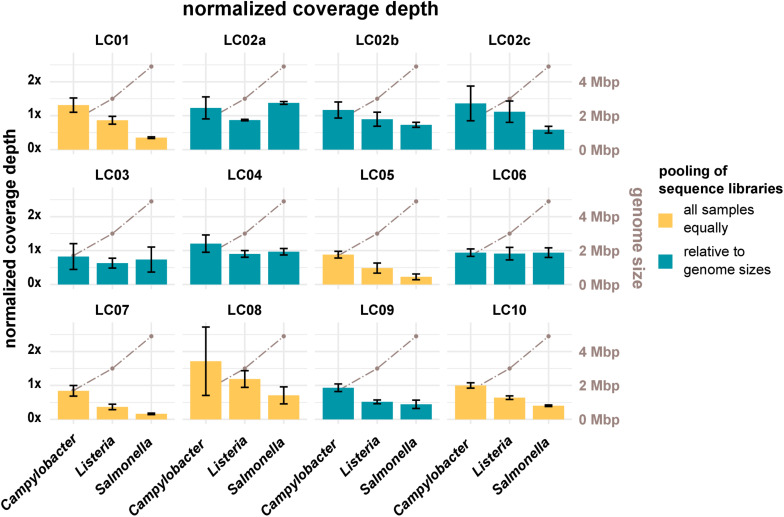
FIGURE 3.
The bar plot (left y-axis) shows the mean normalized coverage depth grouped by laboratories and species of the samples with error bar. The coverage depth was normalized for each laboratory to the coverage depth for sample 19-RV1-P64-1, sequencing run A, which was assigned a value of 1. The coverage depth was defined as the sum of the length of all raw reads divided by the length of the respective PacBio reference sequence. Fill colors identify, whether DNA libraries were pooled relative to genome sizes prior to sequencing or whether DNA libraries were pooled equally. The brown line graph in the background (right y-axis) indicates the average genome size of the species.

