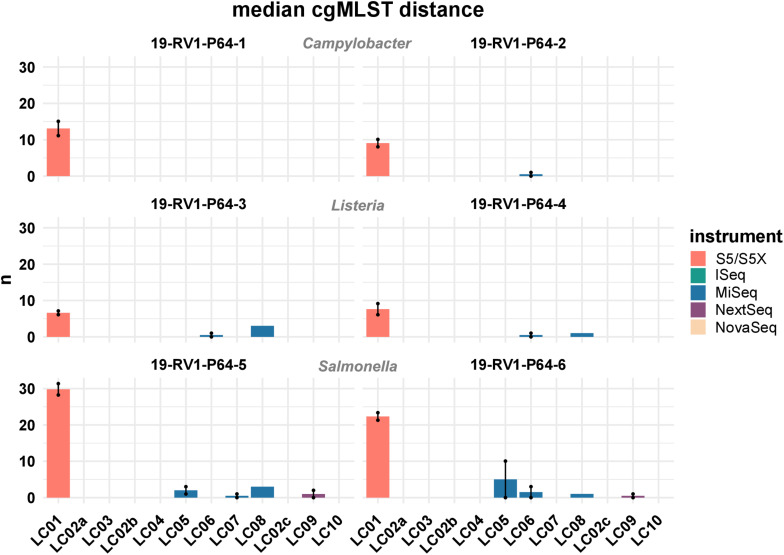
FIGURE 7.
The bar plot shows the mean median cgMLST distance grouped by laboratories and samples. Line-connected points indicate the variance between sequencing runs (run A/run B), with the exception of laboratories LC02 and LC08 (single sequencing run). Fill colors identify the sequencing instrument. The species of the samples is indicated.

