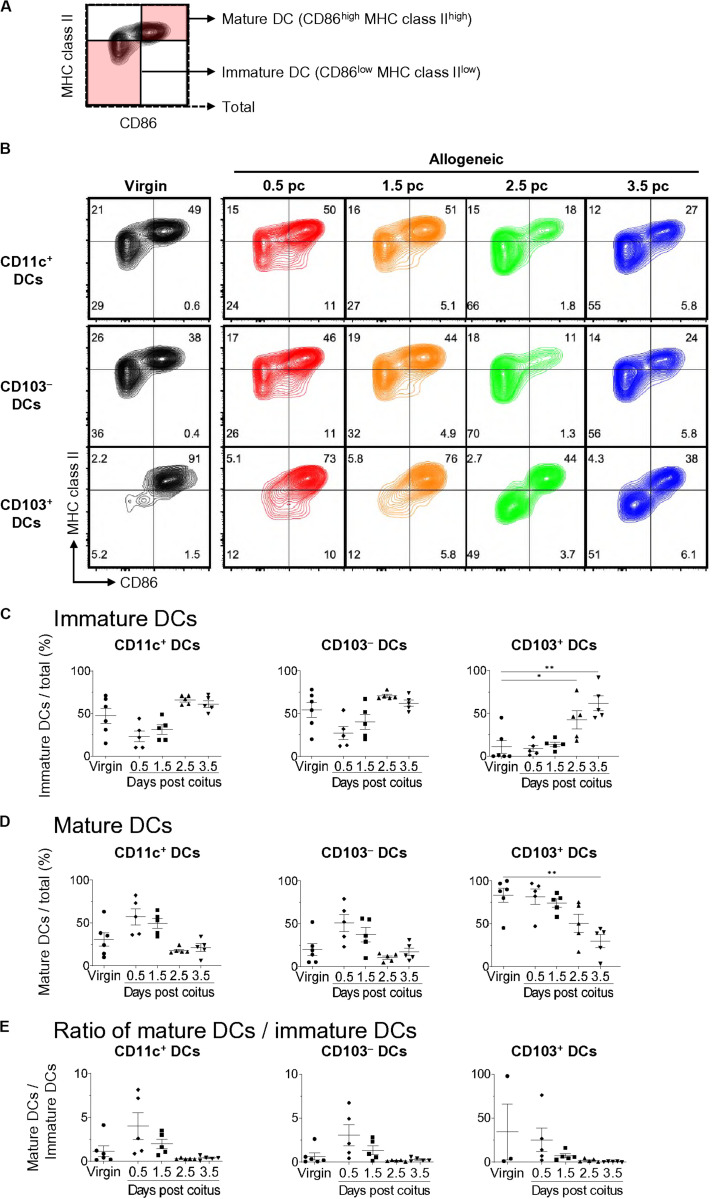
FIGURE 2.
Time course for uterine immature and mature DCs after coitus in allogeneic mating. (A,B) Flow cytometry contour plots show immature DCs and mature DCs based on the expression of CD86 and MHC class II (A), and representative plots in proportion to those within each DC subset at each time point (B). (C–E) Graphs show the proportion of immature DCs (C) and mature DCs (D) out of the total DCs, and ratio of mature DCs/immature DCs (E) in each DC subset at each time point. A minimum of five samples from each time point were analyzed. Data represent mean ± SEM (C–E) and are representative of three independent experiments. Statistical comparisons were performed using the Kruskal-Wallis test with Dunn’s multiple comparisons test (∗∗P < 0.01, ∗P < 0.05).

