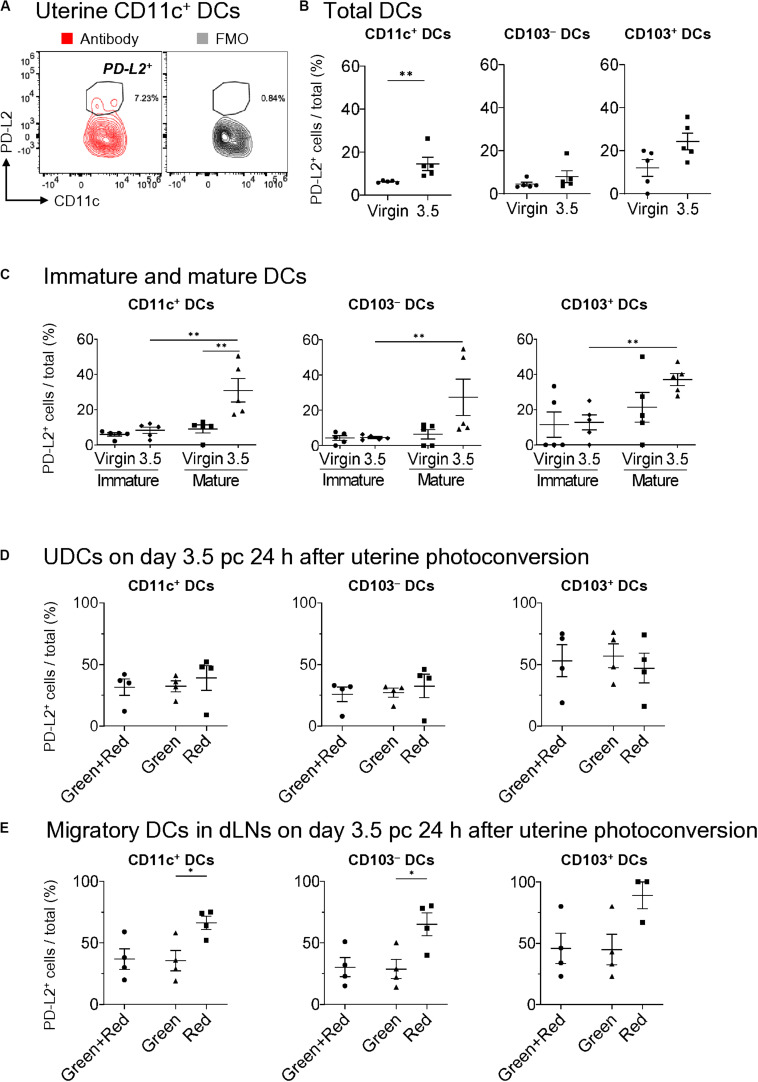
FIGURE 5.
Expression of PD-L2 in uDCs increased immediately before implantation. (A) Flow cytometry contour plots show expressions of PD-L2 in uterine CD11c+ DCs with fluorescence minus one (FMO). (B,C) Proportion of PD-L2+ DCs of total DCs (B), immature DCs, and mature DCs (C) in allogeneic mating at each time point. (D,E) Proportion of PD-L2+ DCs within the uterus (D) and dLNs (E) in allogeneic mating 24 h after uterine photoconversion on day 3.5 pc. A minimum of five (B,C) and four (D,E) samples from each time point were analyzed. Data represent mean ± SEM (B,C) and are representative of three independent experiments. Statistical comparisons were performed using Mann-Whitney U-test (B,C) and Kruskal-Wallis test with Dunn’s multiple comparisons test (D,E) (∗∗P < 0.01, ∗P < 0.05).

