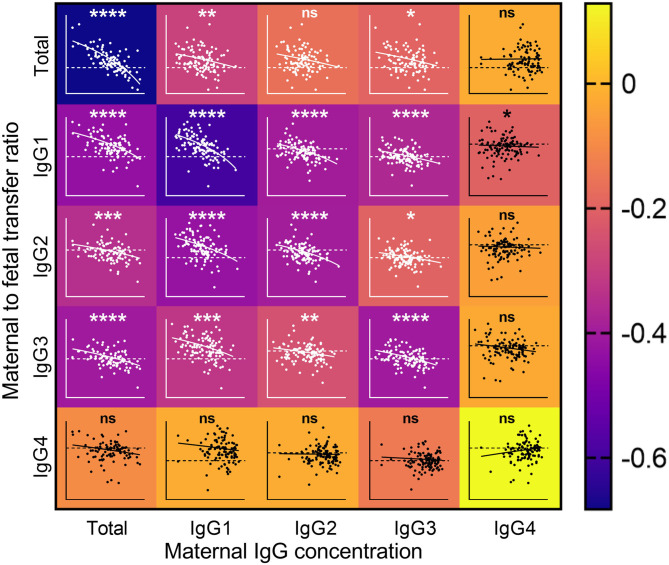
Figure 3.
Impact of maternal IgG concentrations on the rate of maternal to fetal IgG transfer. Heatmap with overlaid scatterplots showing the effect of increasing concentrations of maternal IgG (X axis) on the transfer rates of total IgG (TIgG) and IgG1–4 from mother to fetus (Y axis, Log2 scale). Horizontal dashed line represents equal levels between mother and fetal circulations. Correlations between nlog-transformed maternal IgG concentrations and log(2)-transformed transfer ratios were analyzed by Spearman's rank correlation coefficient. The scale on the right indicates the color associated with the Spearman r-values. Inverse correlations are depicted in the darker shades, and weaker and no associations are depicted in lighter shades toward yellow. The lines on the scatterplots indicate simple linear regressions. ****p < 0.0001, ***p < 0.001, **p < 0.01, and *p < 0.05.

