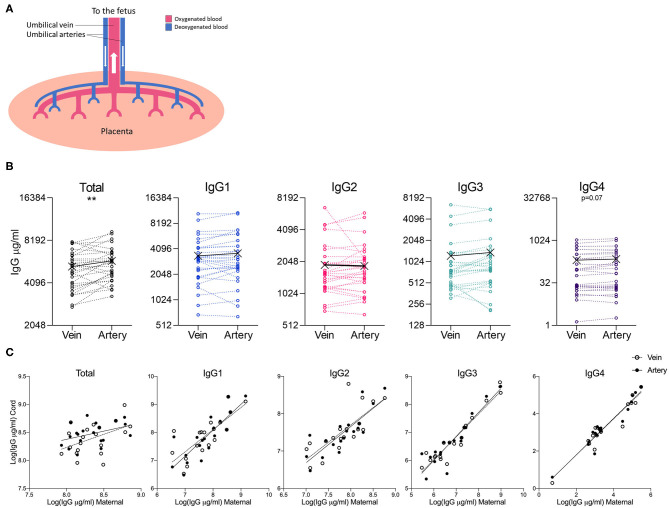
Figure 4.
Comparison of IgG subclasses in umbilical cord vein and arterial blood. (A) Illustration of the placental circulation, showing the umbilical arteries bringing deoxygenated blood from the placenta to the fetus, and oxygenated blood returning to the fetus from the placenta via the umbilical vein. (B) Dot-line plots showing the relationship between IgG concentrations in paired umbilical cord vein and artery serum samples (n = 30). Groups compared by paired t-test on nLog-transformed data. **p < 0.01 (C) Correlations between maternal and cord IgG concentrations. Lines indicate simple linear regression. nLog values analyzed by Pearson r-test. N = 30 matched umbilical vein/umbilical artery serum pairs and 20 matched maternal/umbilical vein/umbilical artery serum trios.

