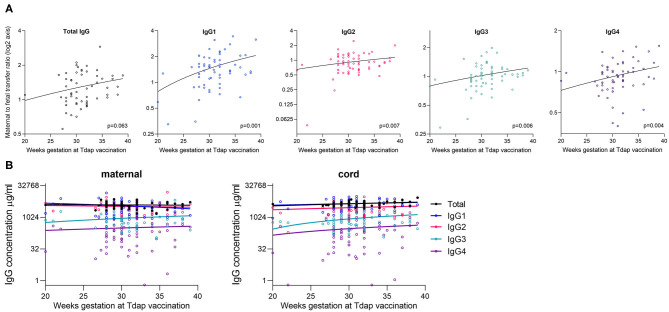
Figure 6.
Correlation between gestation at Tdap vaccination and placental transfer of total IgG and IgG subclasses. (A) Correlation between the gestation that pregnant women received the Tdap vaccine and the maternal to fetal IgG transfer ratio for total IgG and IgG subclasses [log(2) Y-axis]. Analysis was performed on log(2) transformed ratios by Spearman's rank correlation coefficient, and resultant p values are stated in the bottom right corner of each plot. Coefficients: Total IgG: 0.242, IgG1: 0.316, IgG2: 0.171, IgG3: 0.353, and IgG4: 0.316. (B) Correlation between the gestation at vaccination and the antibody concentration in maternal blood and cord blood at birth. Analysis performed on log-transformed data by Spearman's rank correlation coefficient. All correlations non-significant at p > 0.05 level. Lines indicate simple linear regression. Coefficients for maternal IgG: Total IgG: −0.044; p = 0.752, IgG1: −0.145; p = 0.262, IgG2: −0.180; p = 0.161, IgG3: 0.013; p = 0.919, IgG4: 0.029; p = 0.823. Coefficients for cord IgG: Total IgG: 0.235; p = 0.079, IgG1: 0.197; p = 0.125, IgG2: 0.134; p = 0.296, IgG3: 0.164; p = 0.199, and IgG4: 0.191; p = 0.133. N = 63.

