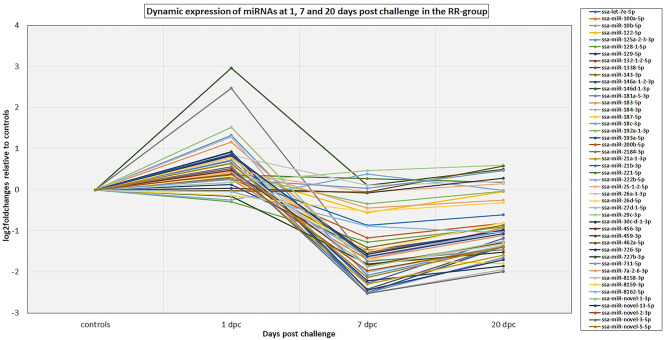
Figure 3.
The dynamic expression profiles of miRNAs differentially expressed at either 1, 7, and/or 20 dpc in the RR group. The plot shows the expression changes (log2foldchanges) for each of the miRNAs at each time point post IPNV-challenge relative to controls. Several of the miRNA genes in the same miRNA family showed similar dynamics and to simplify the plot only the major expressed mature member of each family is presented in the plot. The complete results are given in Table S2.

